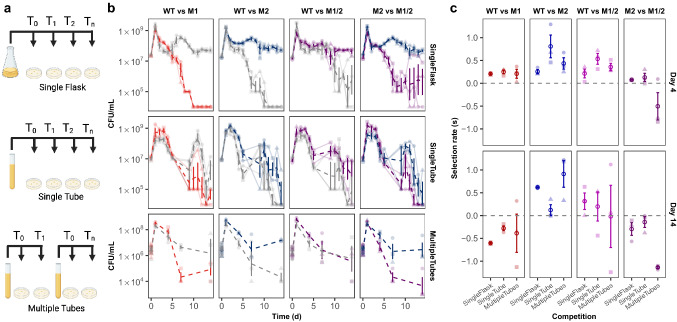
Fig. 2.
Competition dynamics between three engineered mutants and their WT ancestor differs based on sampling method. a Three sampling methods used for competitions included repeatedly sampling a single competition grown in a flask (Single Flask) or tube (Single Tube) or sampling a competition tube once in which one competition tube is sampled per time point (Multiple Tubes). b Viable plate counts, expressed as CFU/ml, of competitions between engineered mutants M1 (red), M2 (blue), and M1/2 (purple) and their WT ancestor (grey) using the three different sampling methods (single flask, single tube, multiple tubes) over a period of 14 days reveal variations in competition dynamics. Emboldened dashed lines represent the average CFU/ml of the lightly shaded dashed lines of the three replicates (circle, triangle, square) measured over 14 days of continuous growth. c Selection rate (s) for each matchup on day 4 and 14 of the pairwise competitions when performed using three different sampling methods. Lightly shaded data points represent each biological replicate (circle, triangle, square) while the emboldened open circle represents the mean. All error bars represent 95% confidence intervals (Color figure online)

