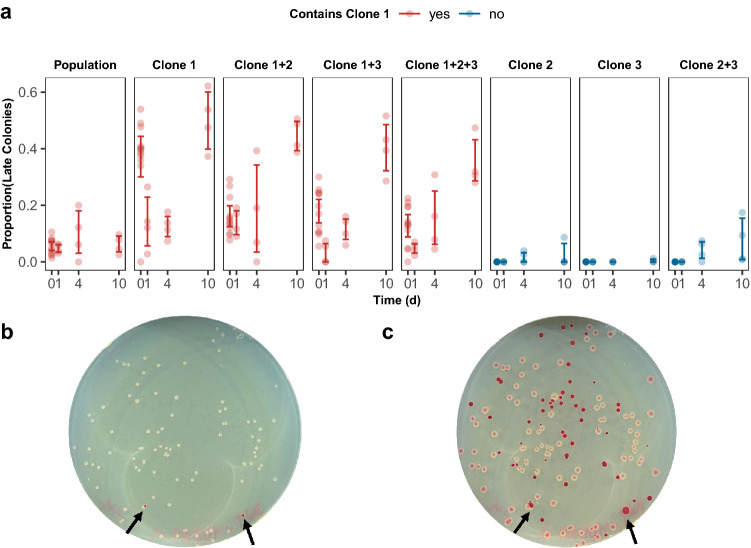
Fig. 5.
Heterogeneity of colony development in evolved lines aThe proportion of colonies appearing after 24 h of incubation (late colonies) in various shown monocultures or co-culture competitions against their WT ancestor that either contain Clone 1 (red) or do not contain Clone 1 (blue) after 0,1,4, and 10 days of growth. Competitions which included Clone 1 displayed an increase in the proportion of late colonies. Each data point represents the proportion of colonies appearing on TA media after 24 h of incubation prepared from serially diluted competition tubes. Error bars represent 95% CI. Representative plates after b 24 h and c 48 h of incubation with arrows denoting red colonies (Color figure online)

