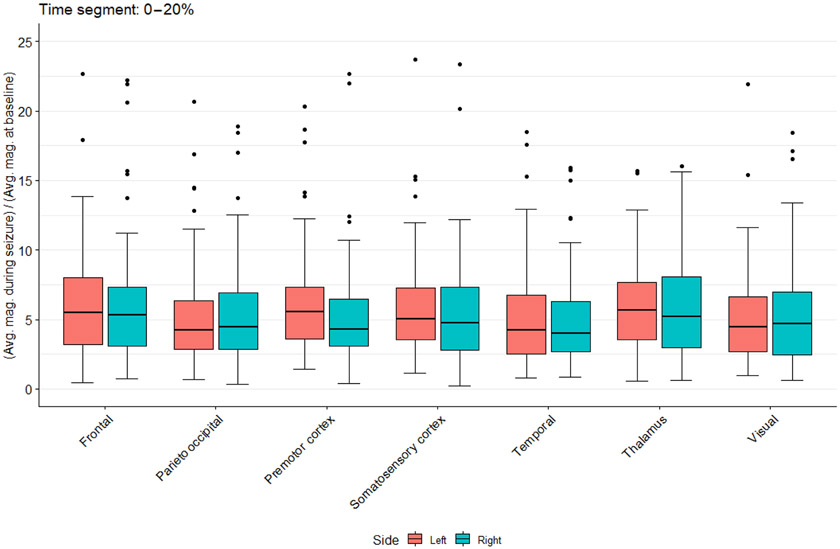
Fig. 2. EEG source localization in G1D.
Estimated current density magnitude changes relative to baseline for several modeled brain regions during the first 0 to 20% time segment of 81 seizures. Regions include several cortical areas in addition to the thalamus. The mathematical model of the brain included the cerebral ventricles and white matter as these structures influence the conduction of electricity through the brain.

