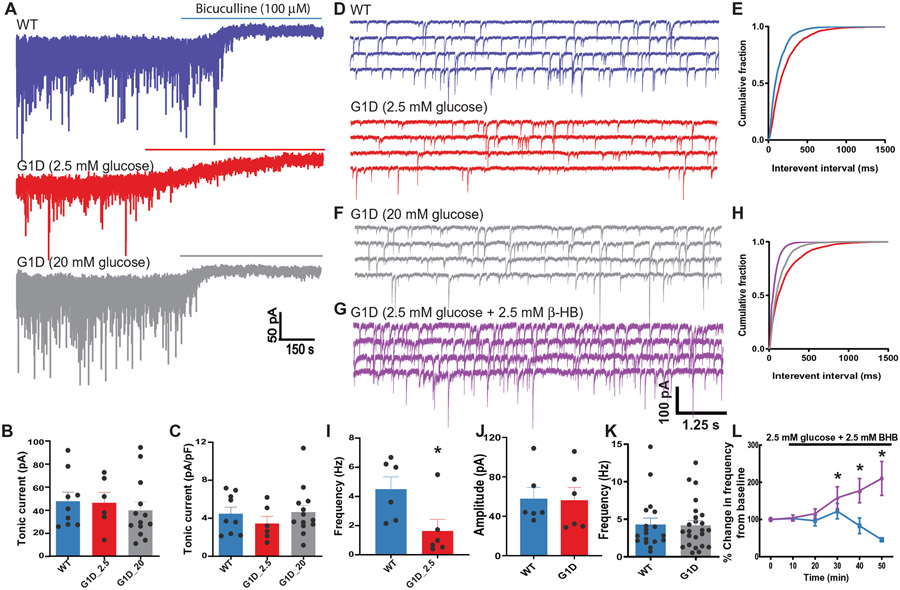
Fig. 6. Inhibitory neurotransmission onto VB relay neurons in G1D.
(A) Voltage clamp recordings of sIPSCs in VB relay neurons in control (WT, blue) and G1D mice (red, gray). Horizontal bar indicates the duration of perfusion of bicuculline to block both synaptic and tonic conductance. (B and C) Mean shift in holding current in recordings from control and G1D VB neurons. (D) Representative voltage clamp recordings as in (A) at expanded time resolution illustrating reduction in sIPSC frequency compared to control in G1D slices perfused with 2.5 mM glucose. (E) Cumulative probability plots of sIPSC frequency from control (blue) and G1D (red) VB relay neurons. (F) Voltage clamp recordings of G1D VB relay neuron perfused in 20 mM glucose shown in (A) at expanded time scale. (G) Voltage clamp recordings of G1D VB relay neuron perfused with 2.5 mM glucose and 2.5 mM β-HB. (H) Cumulative probability plots of sIPSC frequency from G1D VB relay neurons under 2.5 mM glucose (red), 20 mM glucose (gray), and 2.5 mM glucose with 2.5 mM β-HB (purple). (I and J) Summary differences in sIPSC frequency (I) and amplitude (J) between 2.5 mM glucose–perfused (red) and 20 mM glucose–perfused (blue) G1D neurons. (K) Summary results for sIPSC frequency on VB neurons. (L) Percentage change in sIPSC frequency in VB neurons (G1D, purple; control, blue) measured from recordings in 2.5 mM glucose for 10 min, followed by the addition of 2.5 mM β-HB. *P < 0.05, compared to WT (I) or G1D in 2.5 mM glucose (L).

