
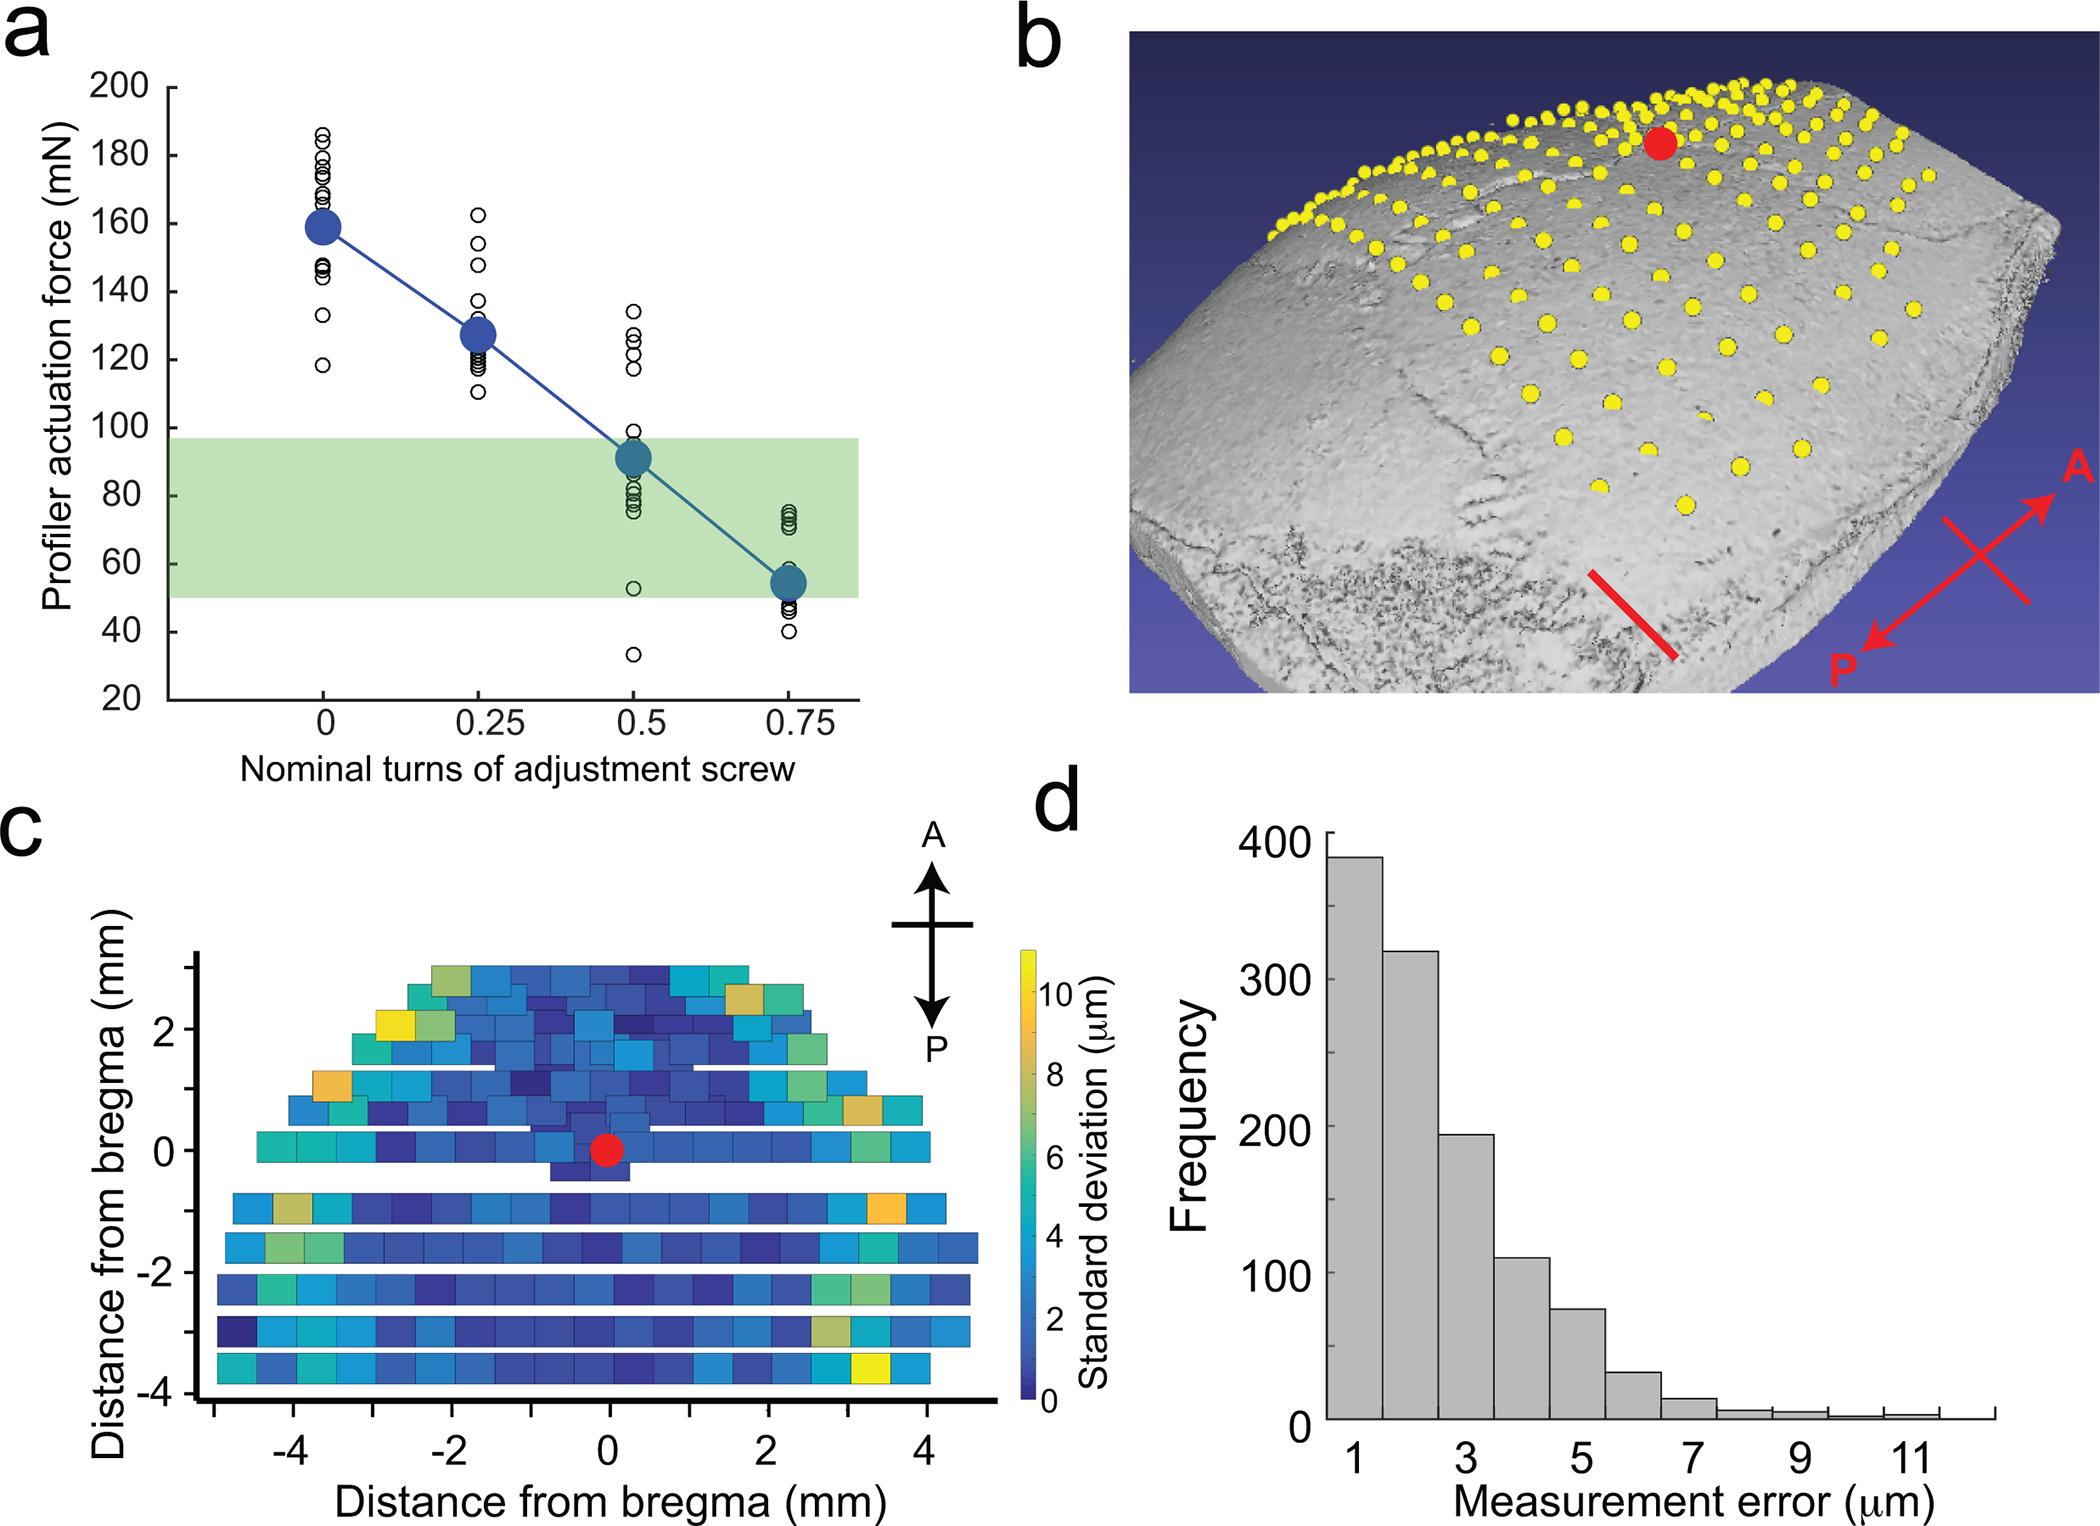
Figure 5. Surface profiler performance.
(a) Calibration curve indicating the change in actuation force required to trigger the surface profiler as a function of nominal turns of the adjustment screws. The green bar indicates the range of actuation forces in which the surface profiler can be used for profiling the skull surface. (b) Average point cloud computed after profiling 192 points across the dorsal cortex of a C57BL/6J mouse skull superimposed on a micro-CT scan of the same subject. Scale bar, 1 mm. The red dot indicates Bregma. (c) Standard deviations of repeated measurements taken across the same points in (b) showing the spatial variation in measurement error. The red dot indicates Bregma. (d) Histogram of measurement errors at 192 points each in six mice. Figure 5 adapted from ref: Ghanbari*, Rynes* et al Sci Rep 2019. All experiments were approved by the University of Minnesota’s Institutional Animal Care and Use Committee (IACUC).