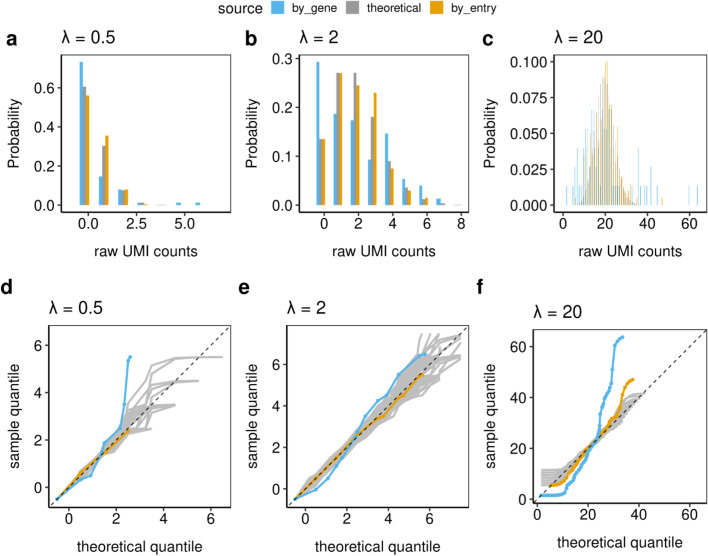
Fig. 1.
The distribution histograms (a–c) and Q-Q envelope plots (d–f) of raw UMI count distributions from 75 biologically clonal cells (Plate 3) as defined in section Methods. The gold bars and lines represent 200 matrix entries with estimated Poisson parameter closest to each ; the blue represents the entries from genes whose gene averages are closest to each ; and the gray represent the theoretical Poisson distributions. These plots indicate that the IPD statistical framework fits the individual matrix entries well, while working with the gene averages indicates that over-dispersion and zero-inflation may occur

