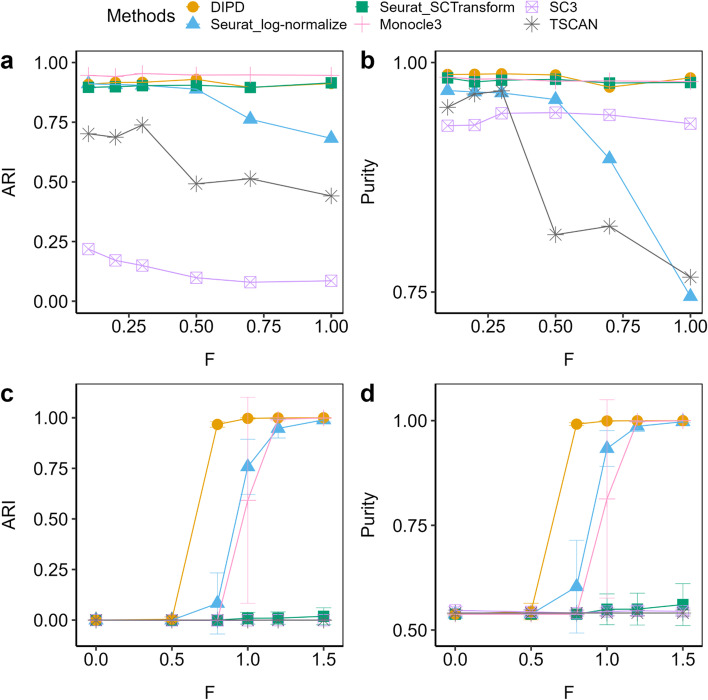
Fig. 9.
Comparison of clustering performances using ARI (panels a, b, c) and purity (panels d, e, f) based on different signal strength F (large F means stronger perturbation) in the Zhengmix4eq data set [29] (a, b, c, d). Panels a and b magnify the library size effects. The DIPD-based data matrix (orange) as a novel data representation shows an improvement over the Seurat log-normalized counts (blue) for larger values of F, and it performs slightly better than the SCTransform (green). Panels c and d create artificial clusters. The DIPD-based representation (orange) uses information from nearly the full set of genes, and performs the best in identifying artificial clusters for relatively small signals. Both Seurat log-normalized expression (blue) and the SCTransform (green) can lose information during the feature selection step, and result in poor clustering

