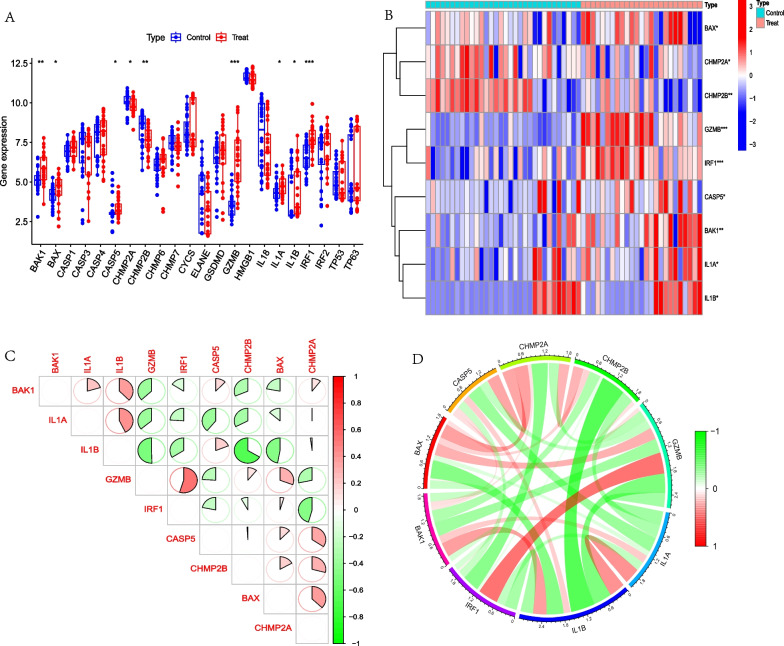
Fig. 2.
Differentially expressed analysis and correlation analysis of PRGs between normal human and AD patients. A. Boxplot showed that 9 PRGs were significantly different between two groups. B. Heatmap showed that 9 PRGs were significantly different between two groups. C. Heatmap showed that IL1B was negative correlation with GZMB and CHMP2B, while GZMB was positive correlation with CHMP2B. D. Circle diagram showed that IL1B was negative correlation with GZMB and CHMP2B, while GZMB was positive correlationwith CHMP2B. *p < 0.05; **p < 0.01; ***p < 0.001

