Fig. 4.
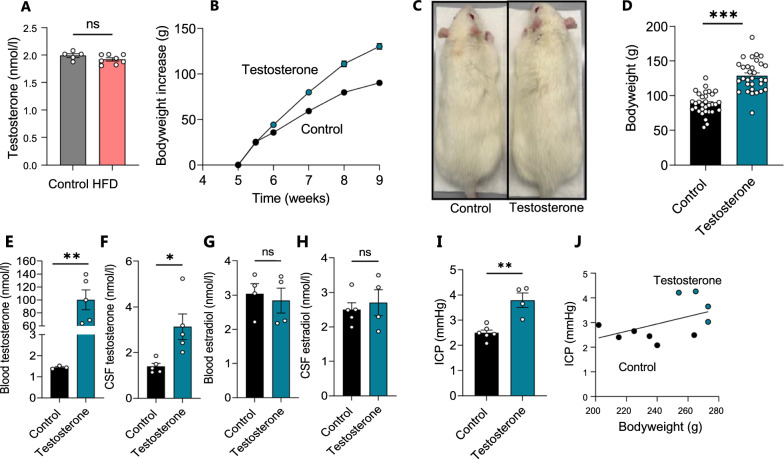
Testosterone treatment increases bodyweight, testosterone levels, and ICP. A CSF levels of testosterone quantified with LC–MS (n = 5–7). B Bodyweight increase as a function of time in all rats treated with testosterone (n = 25) or vehicle (n = 26), with C illustrating a visibly larger testosterone-treated rat and D their bodyweight at the time of experiments. E-F Plasma (E, n = 3–5) and CSF (F, n = 5) levels of testosterone quantified with LC–MS (after one outlier removed from the control group in E). G–H Plasma (G, n = 4) and CSF (H, n = 4–5) levels of 17β-estradiol quantified with LC–MS (after one outlier removed from the testosterone group in G and H). I quantification of ICP in control and testosterone-treated rats (n = 4–6). J Correlation analysis of ICP with bodyweight in control and testosterone-treated rats (R2 = 0.23, p = 0.16, n = 10). Statistical significance evaluated with Student’s unpaired t-test and results shown as mean ± SEM. *p < 0.05, **p < 0.01, ***p < 0.001, ns not significant

