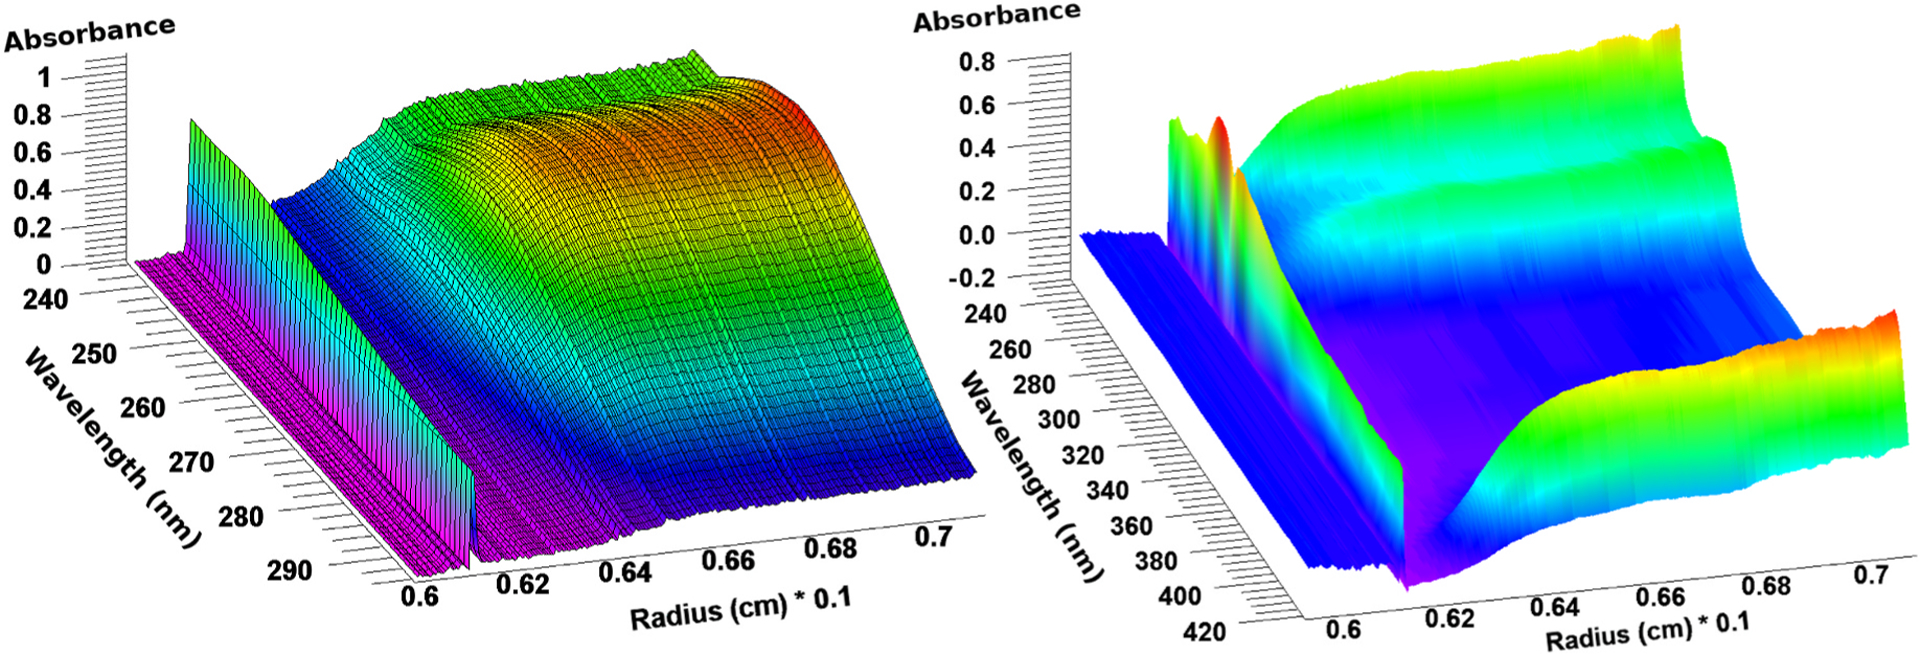
Fig. 1.

Multi-wavelength AUC data from a protein-RNA mixture acquired in the Cölfen optics (left) and a heme protein acquired from the Beckman optics (right). Only the Cölfen optics produce time-synchronous data, the displayed data from the Beckman optics contain wavelength data that are collected at different times, an issue that must be addressed before analysis. In both cases the meniscus is visible at the left, the sedimentation direction is to the right. The 410 nm heme peak is clearly visible in the right image.
