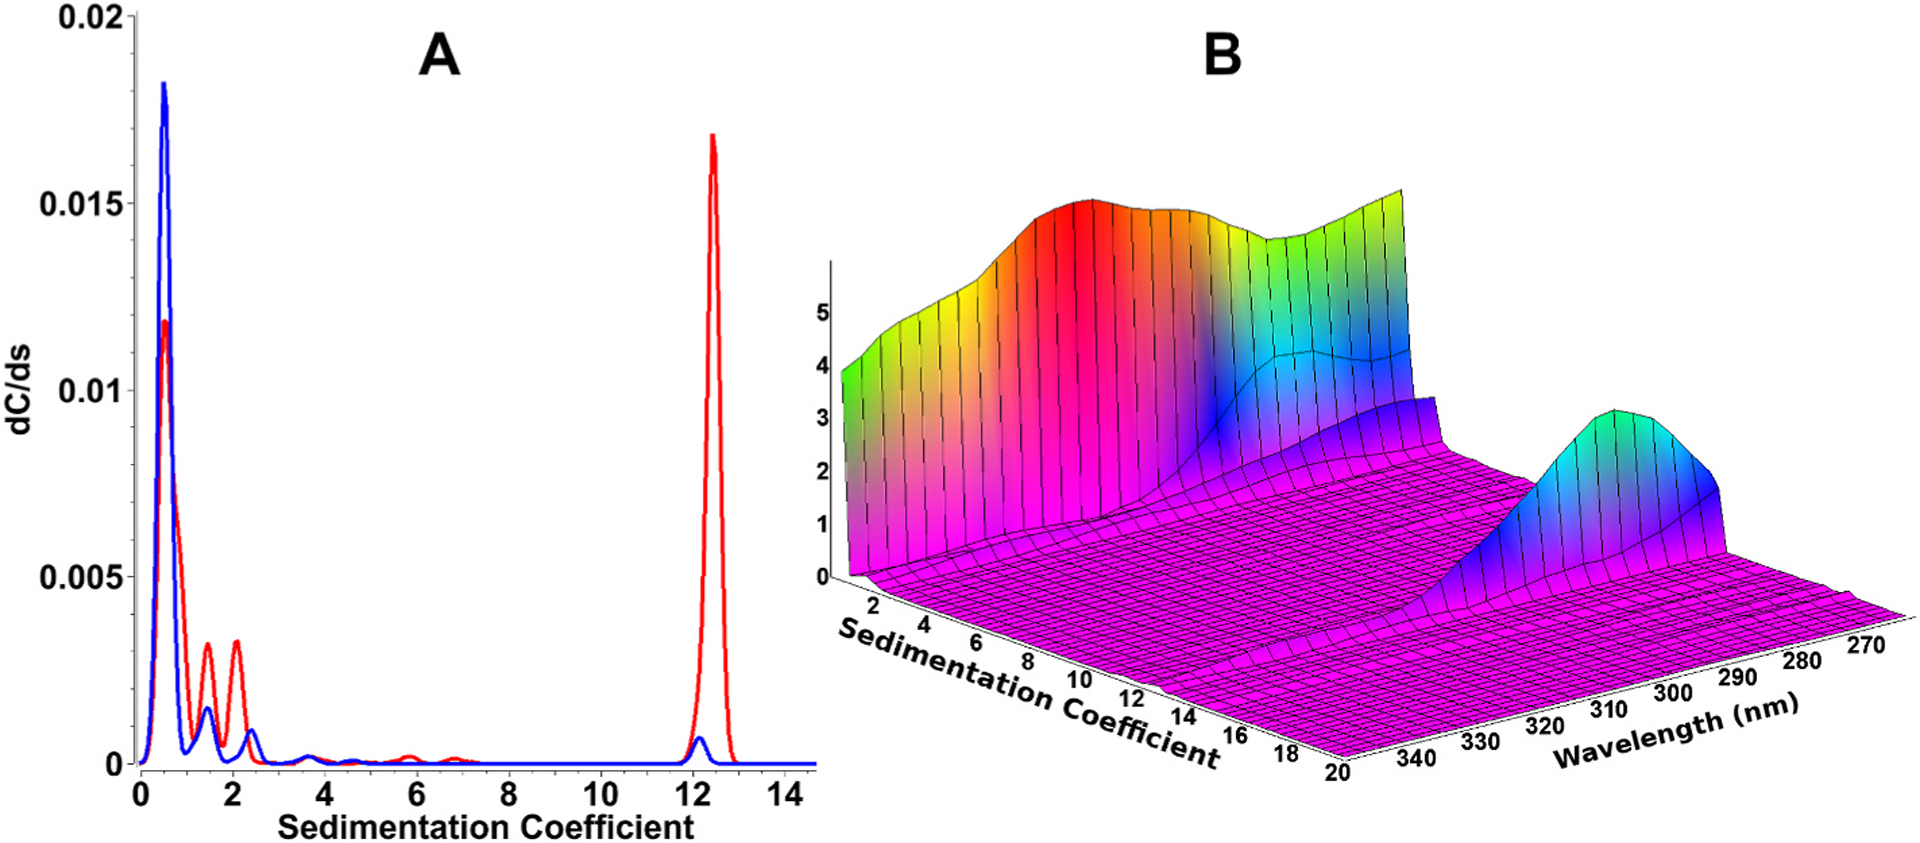
Fig. 2. Sedimentation velocity experiment of oil seed protein extracts.

Panel A: Traditional single-wavelength analytical ultracentrifugation analysis (using 2DSA-IT analysis) at 340 nm (blue trace) and 280 nm (red trace). The two wavelengths clearly result in completely different concentrations for the hydrodynamic species present in the same sample, making an unambiguous interpretation impossible when considering a single, or only a few wavelengths.
Panel B: MW-AUC analysis of the same experiment shown in panel A, covering 260–350 nm. A 3-dimensional representation of absorbance as a function of sedimentation coefficient as well as wavelength is much more informative (composite generated from 2DSA-IT models). For example, the 0.8 S species is easily identified as a polyphenol because of its 315 nm absorbance maximum, while the 12.5 S species displays the typical absorbance profile of a protein, with an absorbance maximum at ~280 nm. Smaller species sedimenting at 1.5–2.2S appear to be degraded proteins, with some associated polyphenols. All data shown were collected with the Beckman optical system.
