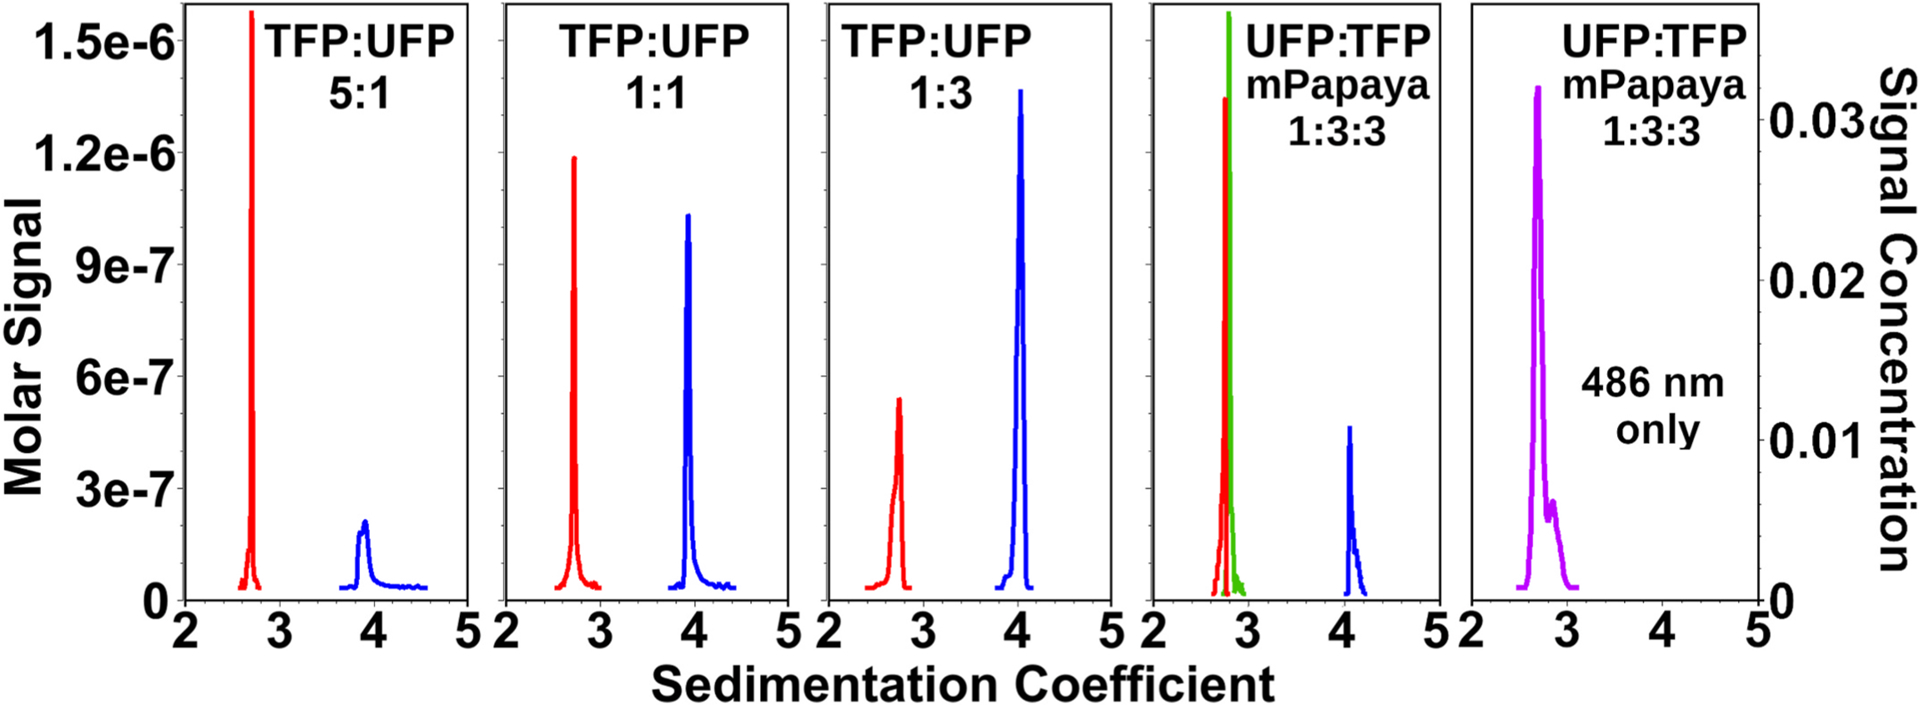
Fig. 3. MW-AUC analysisresolves mixtures of fluorescent proteins.

MW-AUC analysis of mixtures of two or three fluorescent proteins mixed at different ratios: Ultramarine fluorescent protein (UFP, blue), mTeal fluorescent protein (TFP, red), and mPapaya (green). Relative ratios of mixed proteins can be resolved within pipetting error. Panels 1–5 from left to right: 1: TFP:UFP 5:1, 2: TFP:UFP 1:1, 3: TFP:UFP 1:3, 4: UFP:TFP:mPapaya 1:3:3.5: UFP:TFP:mPapaya 1:3:3 (purple), measured at 486 nm only (see SI 2 for spectral overlap at 486 nm). All proteins have identical monomeric mass, but UFP exists as a constitutive dimer, which results in a higher sedimentation coefficient. Note that loading concentrations of mPapaya and TFP are correctly resolved despite having identical sedimentation coefficients, but only when analyzed by MW-AUC. A single wavelength analysis of a 1:1:1 mixture of all three proteins only produces an indistinguishable single peak at 486 nm, where TFP and mPapaya have maximum overlap, because UFP barely absorbs at this wavelength, and TFP and mPapaya have the same sedimentation coefficient.
All analyses shown here were generated from differential g(s) profiles derived from van Holde-Weischet analysis of the spectrally decomposed datasets, except the results in Panel 5, which are based on a traditional AUC experiment at 486 nm.
