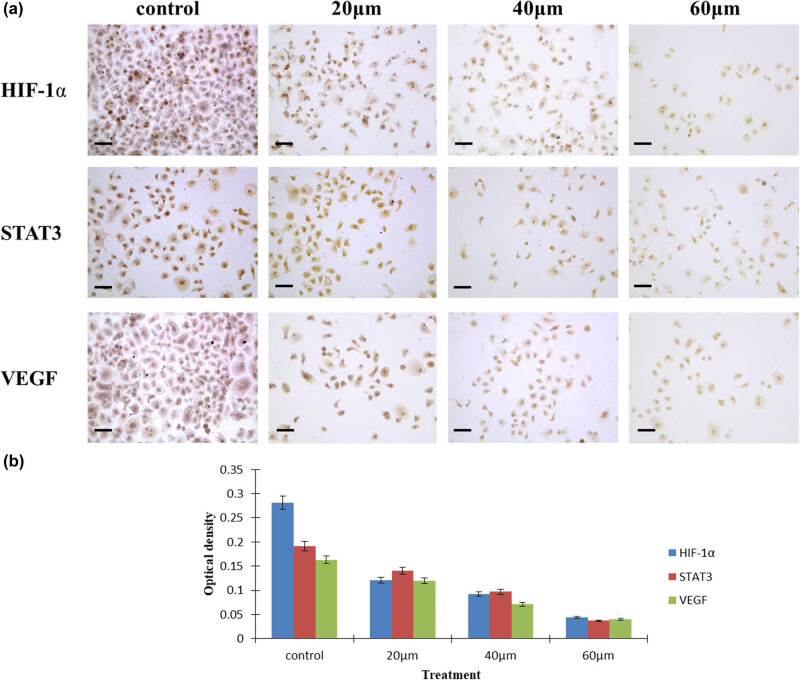
Figure 5.
Expression of STAT3, VEGF, and HIF-1α in HepG2 cells. (a) The locations of STAT3, VEGF, and HIF-1α in hepatocarcinoma cells. (b) The OD values of STAT3, VEGF, and HIF-1α signaling pathways measured after curcumin treatment. In the experimental groups, the OD values of STAT3, VEGF, and HIF-1α were lower compared with the control, n = 4, P < 0.05.

