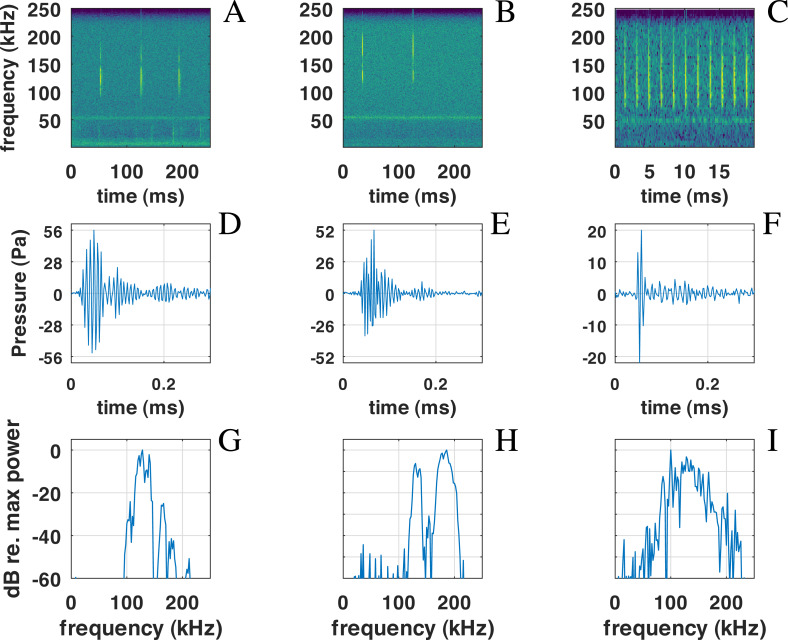
Figure 6. Examples of NBHF clicks recorded by QHB.
On the left (A-D-G), a typical click with peak frequency around 135 kHz. In the center (B-E-H), a less commonly recorded click with peak frequency around 180 kHz. On the right (C-F-I) an example of a click found in a buzz, or rapid sequence of clicks. Top: spectrogram of the signal with a FFT on 210 points (2 ms) except for the right picture (27 points, 0.5 ms), Blackman window, 50% overlap. Middle: zoom on the waveform of the click at the center of the figure just above. Bottom: spectra of the click with normalized intensity, FFT of 29 = 512 points (1 ms of the signal), centered on the detection.

