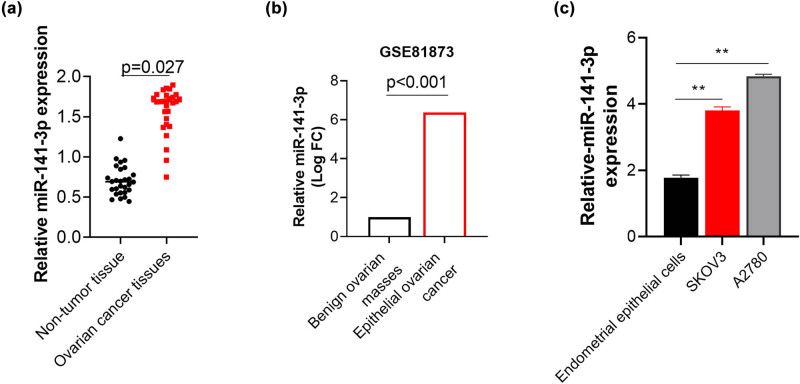
Figure 1.
Expression of miR-141-3p in OC tissues and ovarian cells. (a) miR-141-3p expression in 28 collected paired tissues; (b) miR-141-3p expression in GSE81873 dataset, including 13 benign tissues and 19 epithelial OC tissues. The differential expression was analyzed by GEO2R, an online analysis tool of GEO and demonstrated as Log of fold change (Log FC); and (c) miR-141-3p expression in ovarian cells and normal ovarian cells. ** p < 0.01.

