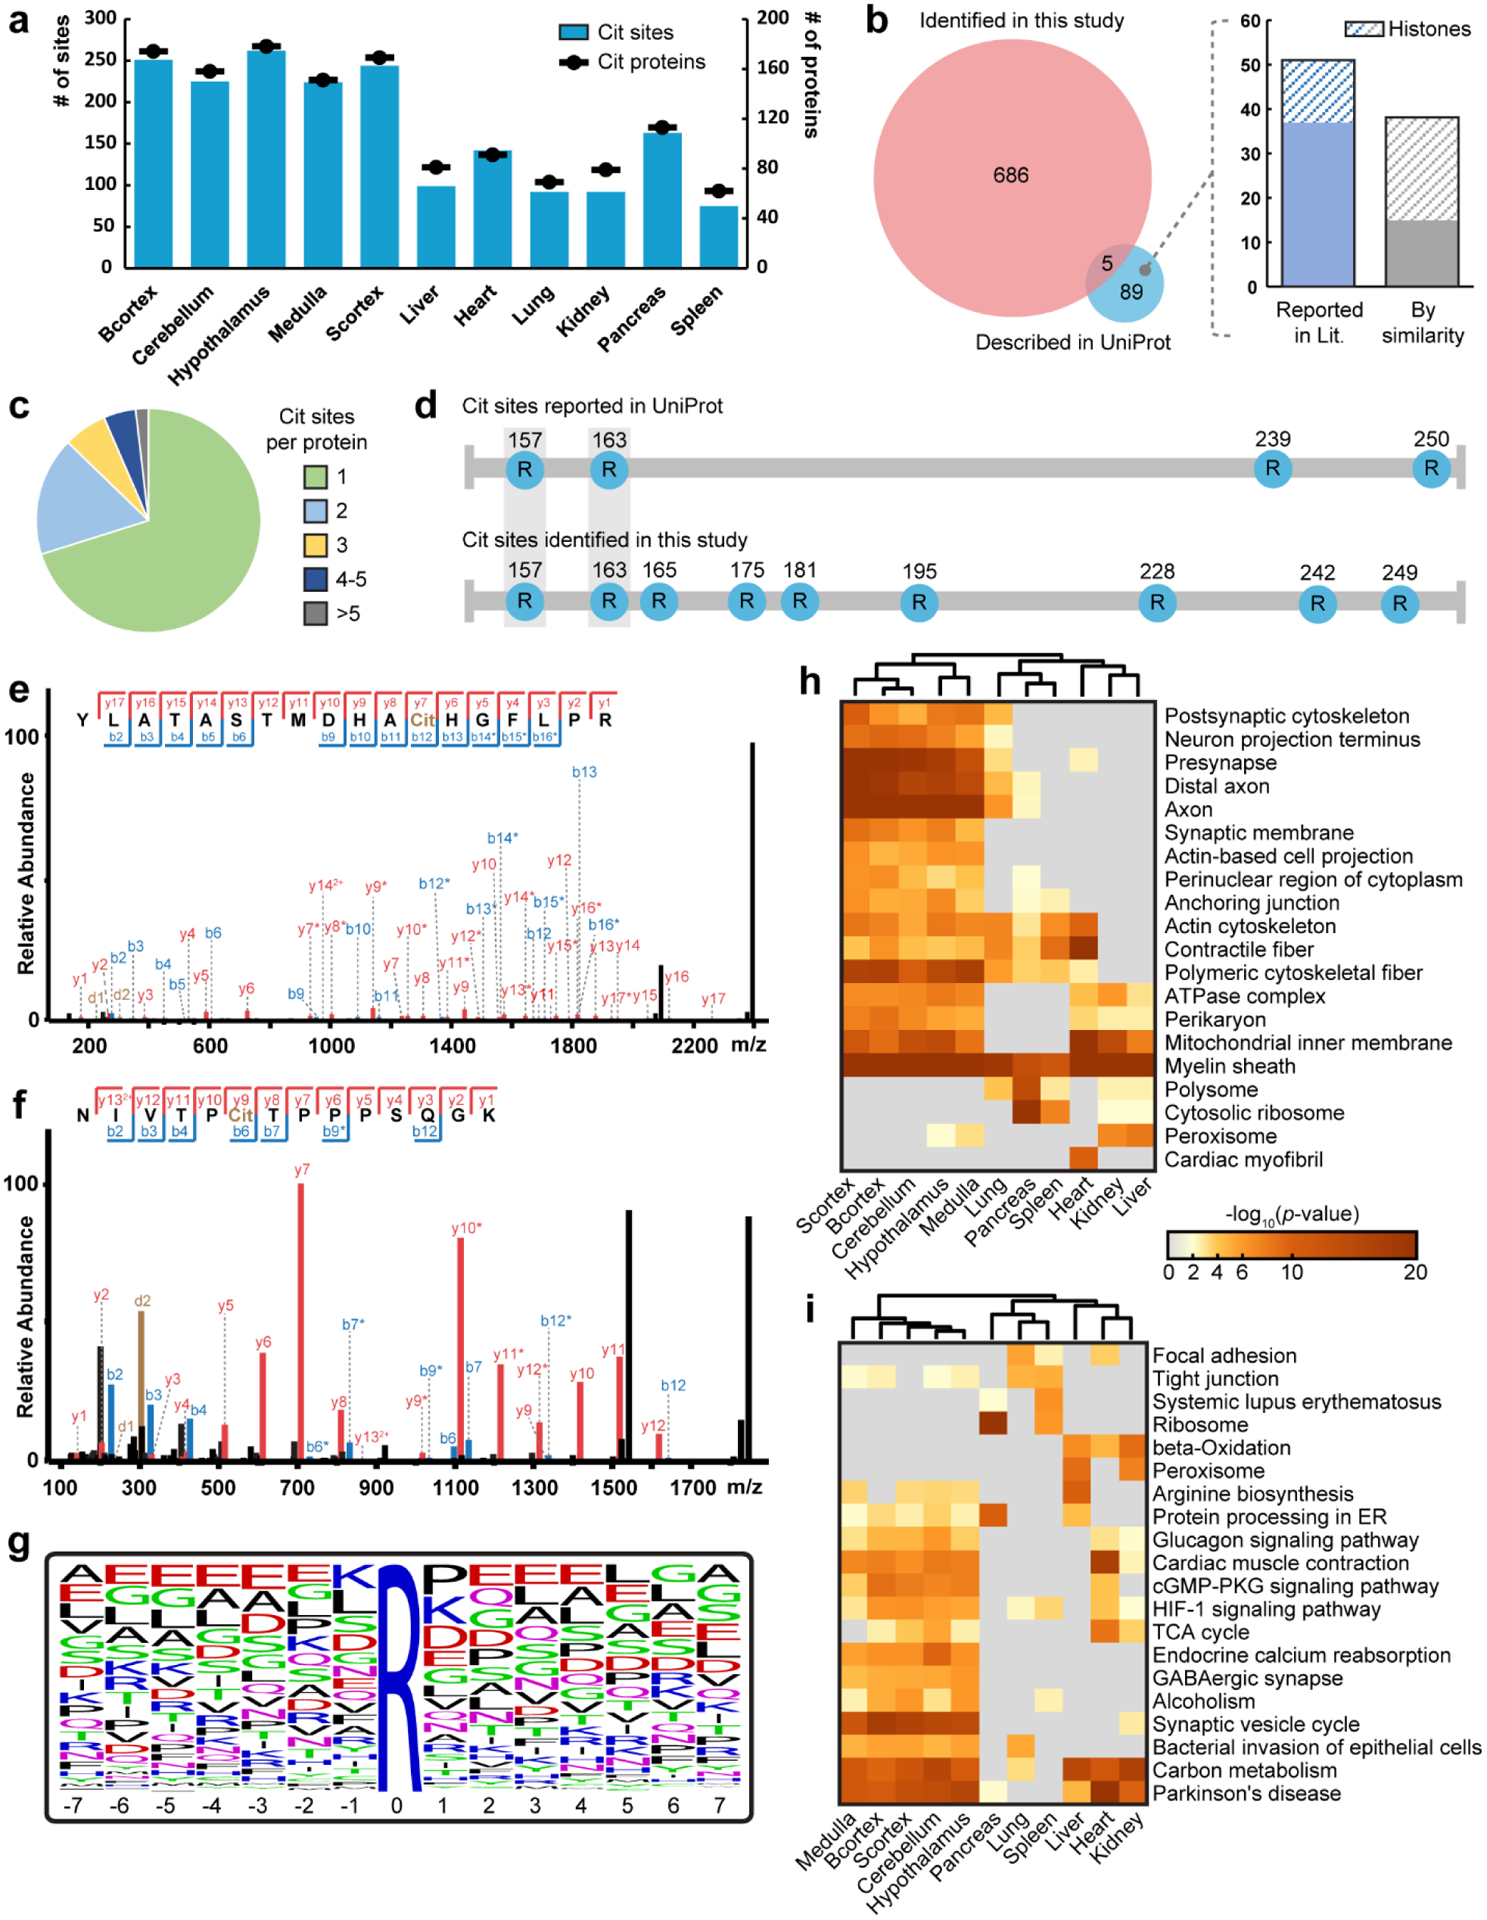
Figure 3. Large-scale citrullinome profiling of different mouse tissues.

a, Number of identified citrullinated proteins and citrullination sites in different mouse tissues. Identification numbers are presented as a total from three mice. Cit, citrullination; Bcortex, cerebral cortex; Scortex, hippocampus and thalamus. b, Overlap of citrullination sites identified in this study with those reported in the UniProt database. Many of the sites only reported in UniProt have that description based on similarity prediction or location on histone proteins. c, Distribution of the number of citrullination sites per citrullinated proteins identified. d, Comparison of citrullination sites identified in this study and those reported in the UniProt database on myelin basic protein. e,f, Example tandem MS spectra of two citrullination sites identified on myelin basic protein, R157Cit (e) and R228Cit (f). g, Sequence motif of identified citrullinated peptides. Citrullination sites are centered in the middle as “0” position. The height of letters indicates the relative frequency of each amino acid at certain positions. h,i, Heatmaps generated using Metascape showing the significantly enriched (p value < 0.01 in at least one tissue region) cellular components (h) and Kyoto encyclopedia of genes and genomes (KEGG) pathways (i) in different mouse tissues. The most significant 20 terms are shown in each heatmap. Color coding indicates −log10 (p values). Columns are clustered based on their profile similarity.
