Figure 4.
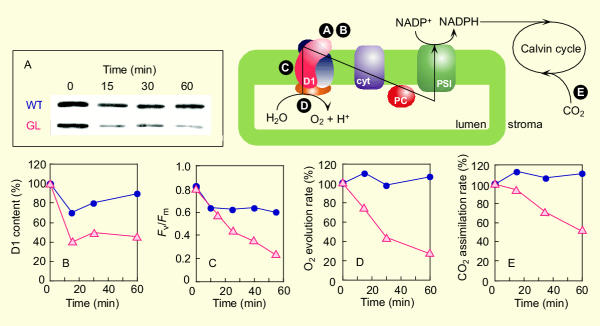
High-light induced photoinhibition of GL assessed by several parameters. Shade-leaves were exposed to high-light (2300 μmol m-2 s-1) at zero time after preexposure to medium-light (1000 μmol m-2 s-1) for 30 min. A schematic illustration shows the outline of photosynthesis including the electron transport process in thylakoid membranes. Letters (A-D) in filled circles, which correspond to those of the panels A-D, represent the sites where the photo synthetic parameters can be measured. A, Immuno blotting of the D1 protein contained in leaf-extract. B, Degradation of the in vivo D1 protein induced by high-light. Each point was plotted using a relative density of band on the gel as shown in A. C, Decline of Fv/Fm induced by high-light. Note that the time indicated represents total illumination time. D, High-light induced inhibition of the activity of O2 evolution from intact detached leaves. E, High-light induced inhibition of the activity of CO2 assimilation in intact detached leaves. Points are taken by a separate measurement in different leaves (A, B, D) or a leaf (C, E). (•, blue), WT; (Δ, red), GL.

