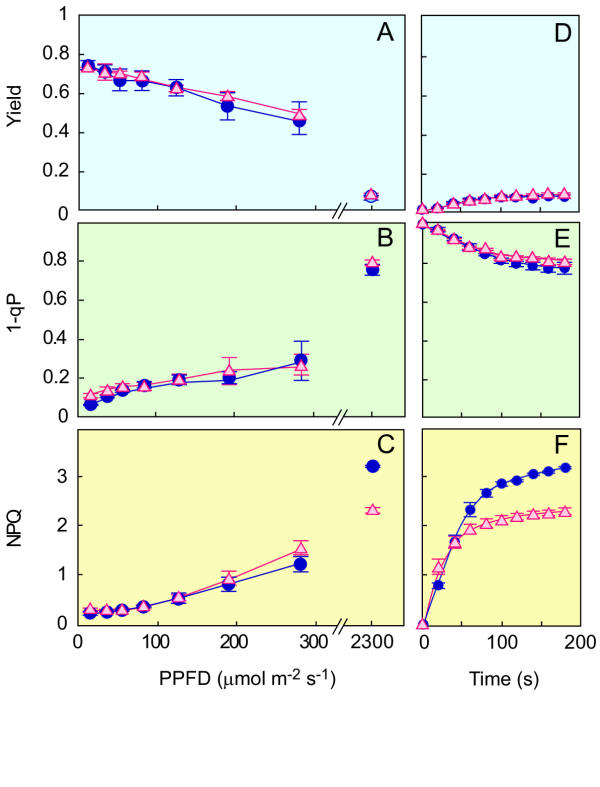
Figure 5.
Yield of PSII (A, D), 1-qp reflecting the reduction state of the qa pool (B, E), NPQ (C, F) in shade-leaves of WT (•, blue) and GL (Δ, red). Each measurement was made after the exposure of leaves to actinic light for 3 min at different intensities (A-C). In D, E and F, high light (2300 μmol m-2 s-1) was used as actinic light to record time courses of Yield (D), 1-qP (E), and NPQ (F). Points are presented as the means of 5 (A-C) or 3 (D-F) separate measurements ± SEM.

