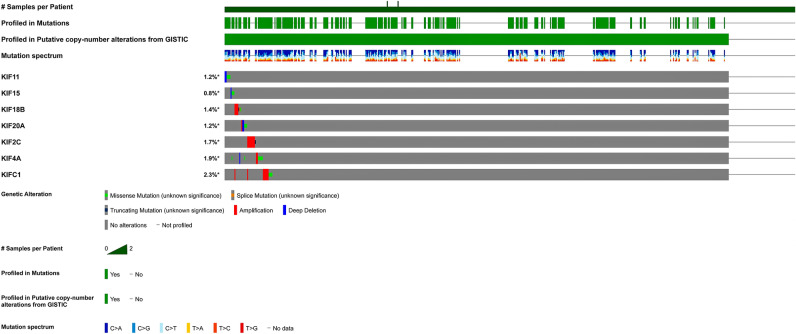
Figure 4.
OncoPrint summarizing genomic alterations of key prognostic kinesins across TCGA-LUAD cohort comprising 584 patient samples. The bottom row represents frequency of genomic alterations in KIF11, KIF15, KIF18B, KIF20A, KIF2C, KIF4A, KIFC1 with red, blue, green, orange, and grey bars signifying amplifications, deep deletions, missense, splice, and truncating mutations, respectively. First, second, third, fourth, and fifth rows depicts the clinical annotation bars such as profiled in putative copy-number alterations from GISTIC, mutation spectrum, sex, tissue source site, and mutation count, respectively.

