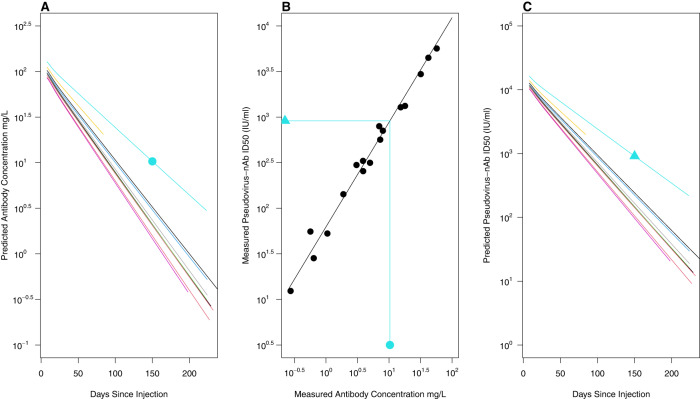
Fig. 6. Derivation of the pseudo-virus neutralization titer decay curves for casirivimab + imdevimab mAb combination.
A Ten randomly selected population PK predicted casirivimab + imdevimab mAb combined antibody serum concentration vs time curves as a function of days since injection. B 18 paired measurements, sampled throughout the course of follow-up (black dots) were used to estimate a linear relationship (black line). A day 150 population PK predicted mAb concentration (turquoise dot) thus results in a predicted ID50 (turquoise triangle). The predicted ID50s were used to generate neutralization titer decay curves (Panel C).

