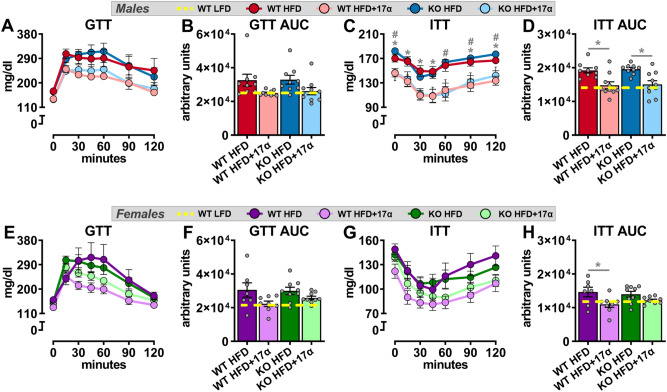
Figure 3.
ERβ partially mediates improvements in insulin responsiveness with 17α-E2 treatment in obese female, but not male, mice. (A) GTT [n = 9–10/group] and (B) GTT AUC [n = 9–10/group] during week 9 in male WT and ERβKO mice. (C) ITT [n = 9–10/group] and (D) ITT AUC [n = 9–10/group] during week 10 in male WT and ERβKO mice. (E) GTT [n = 7–9/group] and (F) GTT AUC [n = 7–9/group] during week 9 in female WT and ERβKO mice. (G) ITT [n = 7–9/group] and (H) ITT AUC [n = 7–9/group] during week 10 in female WT and ERβKO mice. Age-matched, WT, LFD-fed mice were also evaluated as a normal-weight reference group and their corresponding means for both sexes are depicted as dashed yellow lines [n = 9/group]. All data are presented as mean ± SEM and were analyzed within sex by two-way repeated measures ANOVA (A,C,E,G) or two-way ANOVA (B,D,F,H) with Tukey post-hoc comparisons. For panel (C), * represents differences between WT HFD and WT HFD + 17α-E2, while # represents differences between ERβKO HFD and ERβKO HFD + 17α-E2. For panels (D) and (H), * represents differences within genotypes across treatment groups. *p < 0.05.

