
Fig. 3.
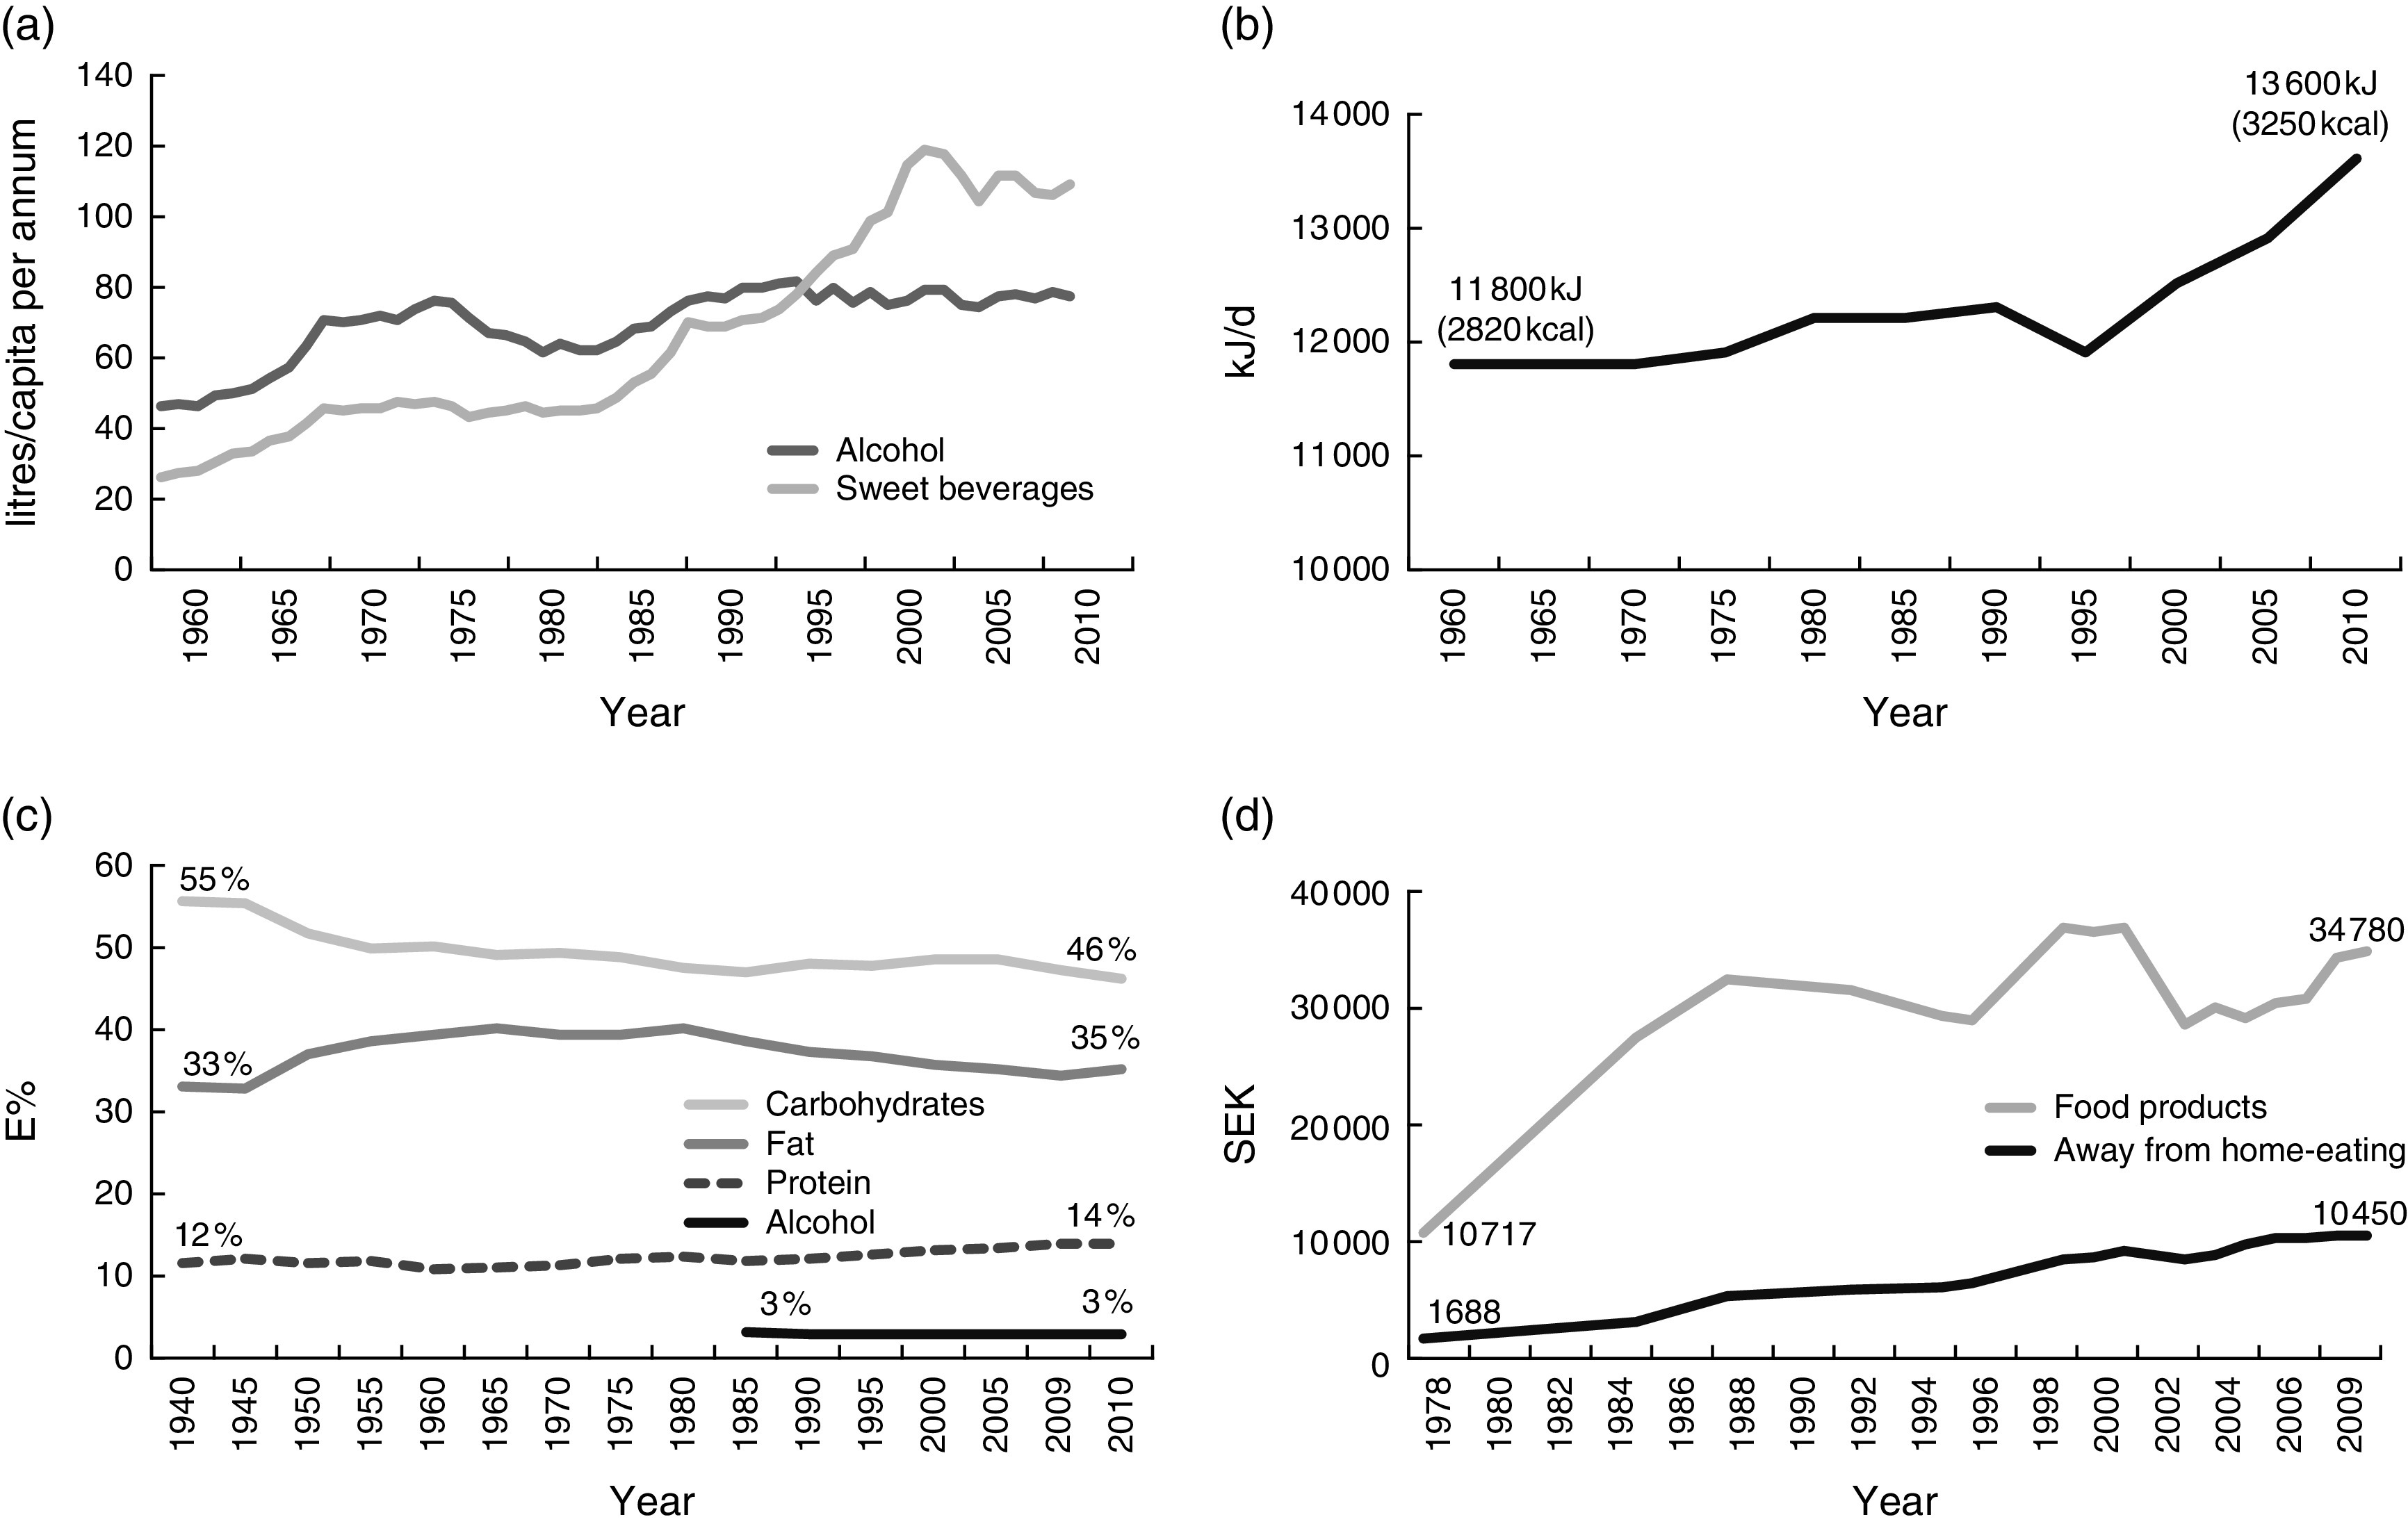
(a) Annual per capita consumption (litres) of alcohol and caloric/non-caloric sweet beverages in Sweden, 1960–2010. (b) Mean daily per capita energy intake (kJ) in Sweden, 1960–2010. (c) Relative contribution of macronutrients to total energy intake (E%) in Sweden, 1960–2010. (d) Average annual household expenditure (Swedish krona, SEK) on food products and away-from-home eating in Sweden, 1978–2009