
Figure 4.
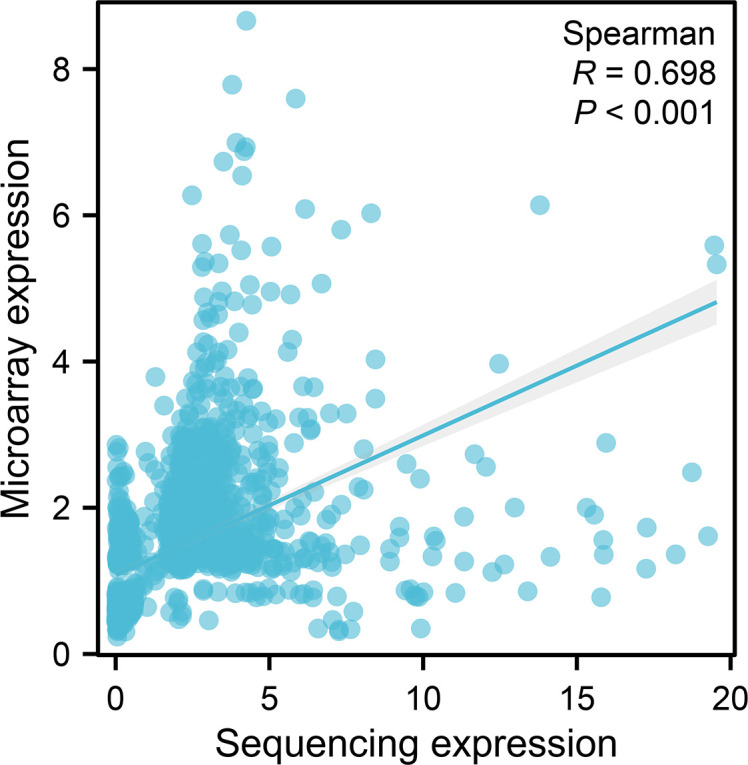
A scatter plot of the expression of the microarray group versus the sequencing group of the common molecules. The horizontal coordinates represent the fold-change expression of sequencing, and the vertical coordinates represent the fold-change expression of microarray. The dots indicate the common molecules between differentially expressed (p < 0.05) molecules based on sequencing and microarray. The line indicates regression line. p-Value and R-value were calculated by Spearman’s correlation.