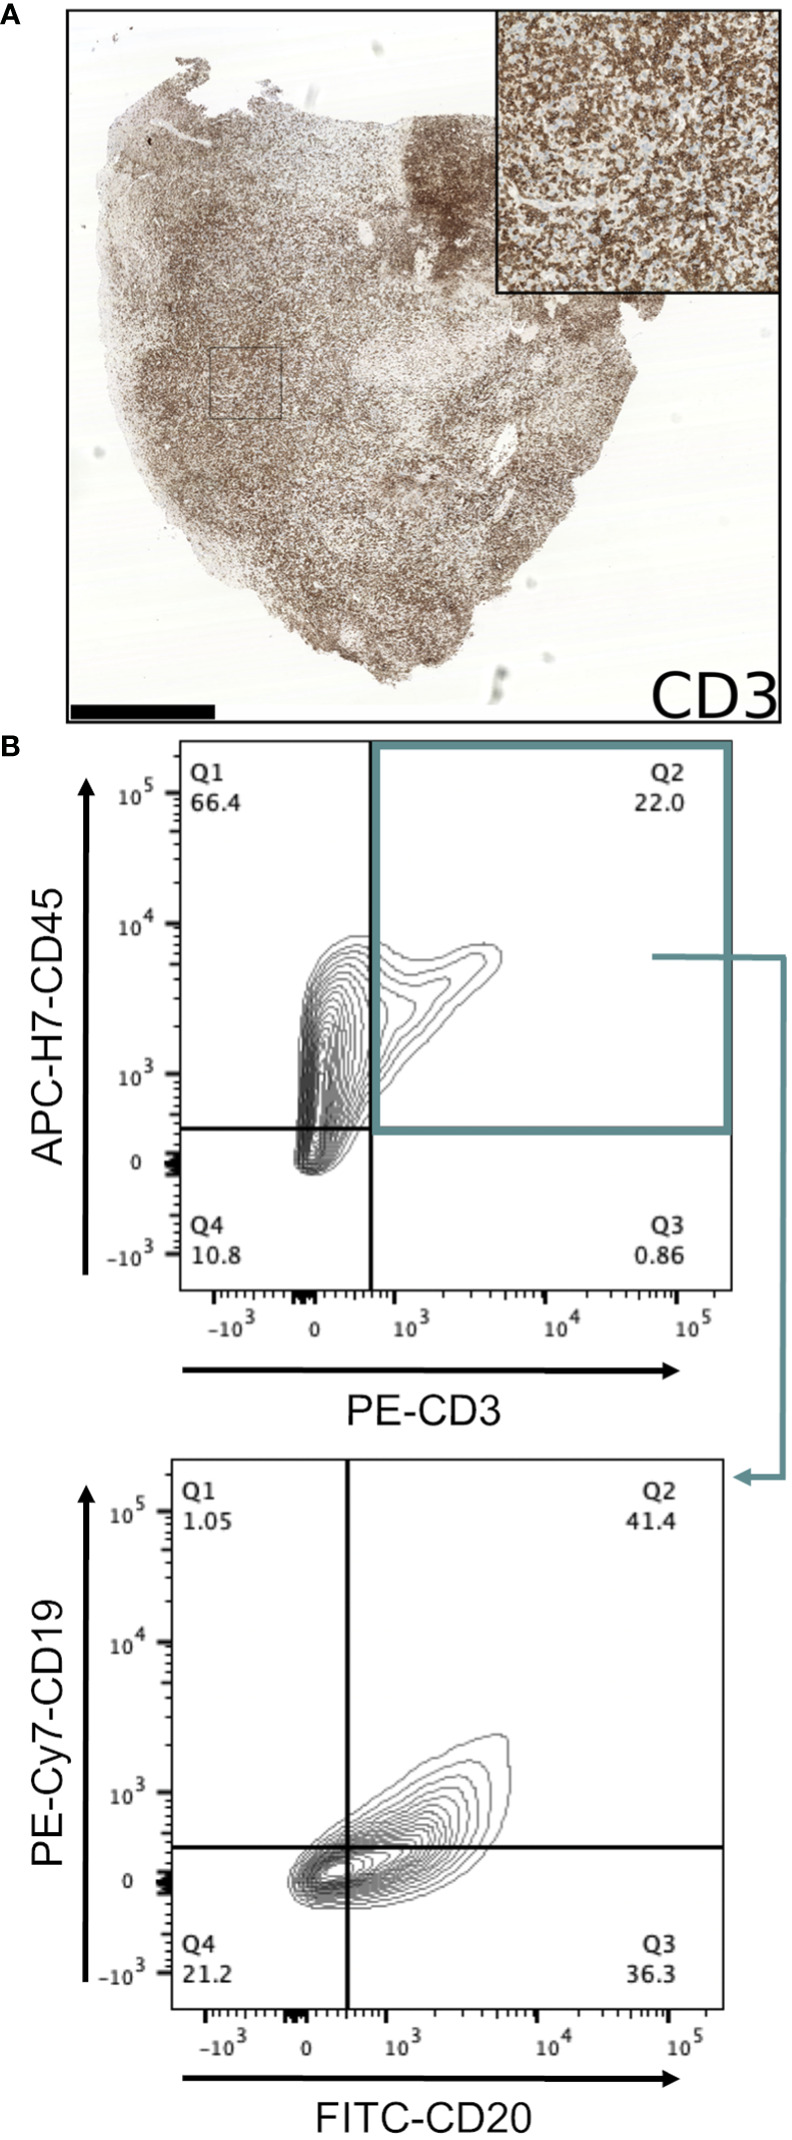
Figure 3.

Investigation of CD3-expressing cells in B lymphoproliferations. (A) Immunohistochemical staining with an anti-CD3 antibody in the CRUK0825 R7 xenograft. Scale bar = 1.0 mm. Inset image is 500 μm in width. (B) Flow cytometry analysis of CD19 and CD20 expression (lower panel) within CD45+/CD3+ cells (upper panel).
