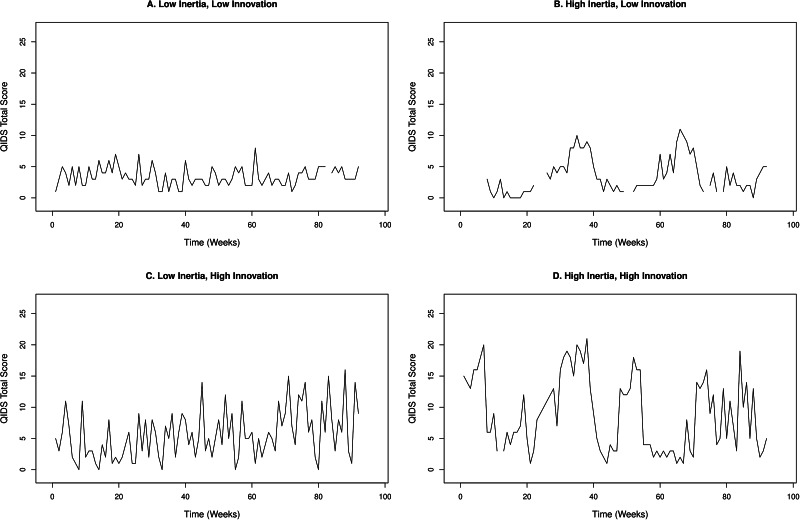
Fig. 2.
Examples of time series data from participants with high and low levels of inertia (ϕii) and innovation (log(πj)) in QIDS (Quick Inventory of Depressive Symptomatology) total scores. 1A – low inertia (0.03), high innovation (1.52); 1B – high inertia (0.79), low innovation (1.77); 1C – low inertia (0.08), high innovation (4.07); 1D – high inertia (0.66), high innovation (4.51). Values shown for innovation are in standard deviations (s.d.) to aid interpretation.

