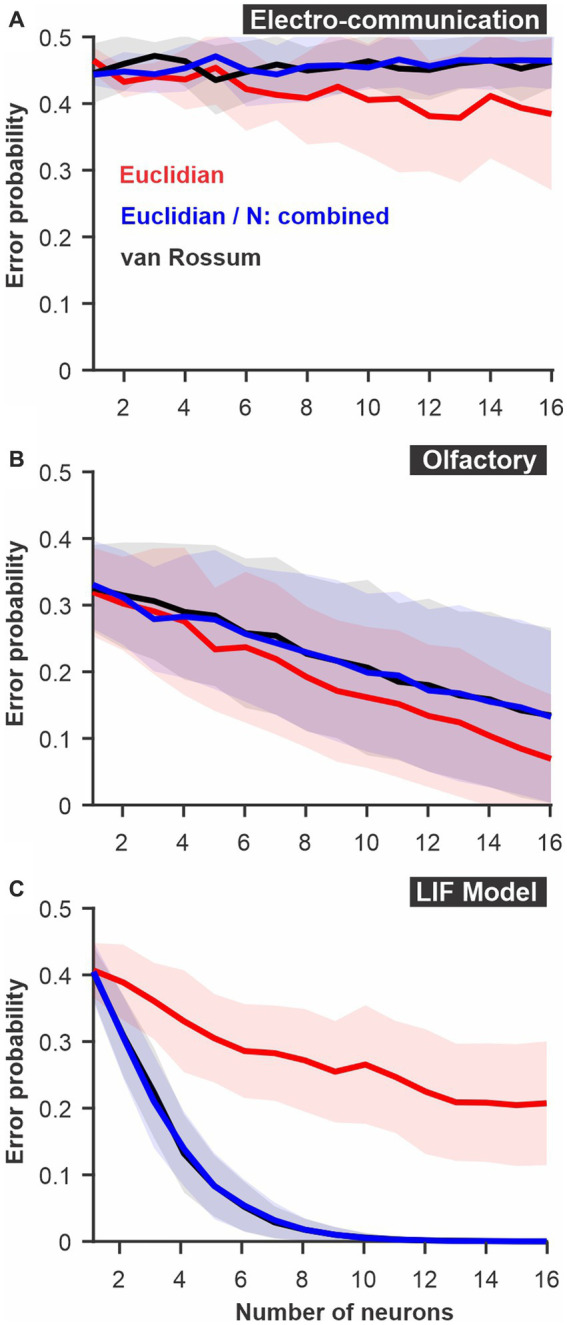
Figure 2.

Discrimination accuracy for populations of neurons using established spike metrics. The probability of discrimination errors (y-axis), based on responses to pairs of different stimuli, was calculated using neural populations of varying sizes (x-axis). We compare methods based on Euclidean distance and the van Rossum spike distance metrics and show that they are very similar when the different neurons are not mapped as different dimensions in Euclidean space but combined (e.g., averaged into a population response). (A) PC neuron responses to electrosensory chirps. (B) PN response of the moth antennal lobe to odors. (C) LIF model responses to frozen white noise stimuli of different shapes. Curves show averages (± s.d.) across all pairs of stimuli (number of stimuli: electrosensory = 3 different chirps, 3 pairs; olfactory = 7 odors, 21 pairs; LIF = 10 noise patterns, 45 pairs).
