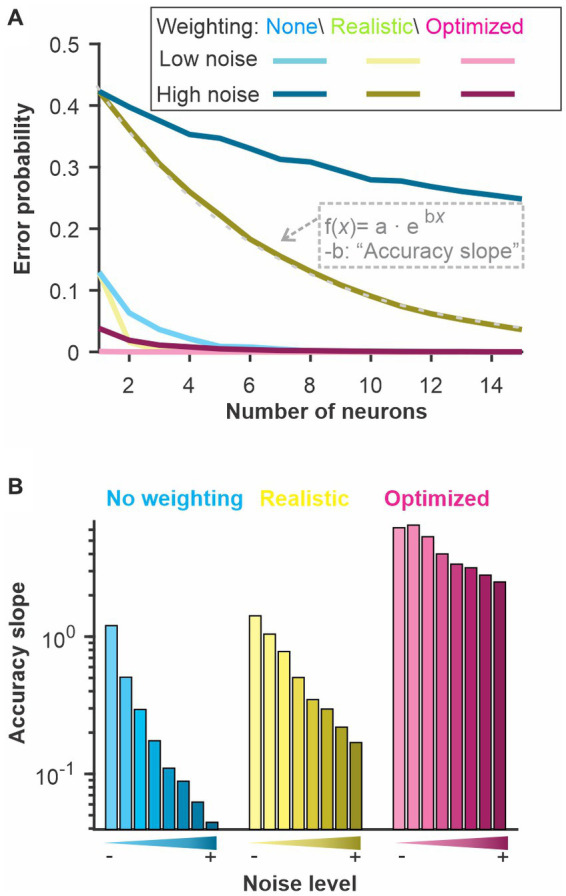
Figure 6.

The discrimination accuracy correlates with the signal-to-noise ratio of the neural responses. Varying the amount of noise in our LIF model we quantified the discrimination accuracy using 3 methods. “No weighting”: Euclidean distance with unweighted dimensions and each neuron kept in separate dimensions; “Realistic”: Each neuron is weighted with a fixed weight across time and the different neurons are combined in a single dimension; “Optimized”: Both neuron and time bins are weighted independently and kept as separate dimensions. The “Accuracy slope” is the slope of the exponential fit for the curves displayed in A and therefore reflects how quickly the error level decreases as more neurons are included in the analysis. A sharp decrease (large absolute value of slope b) indicates a more accurate coding of stimulus identity. We show: (A) the discrimination error probability for a large and a small amount of noise as a function of the neural population size used for the analysis and (B) the derived accuracy for 8 different noise levels.
