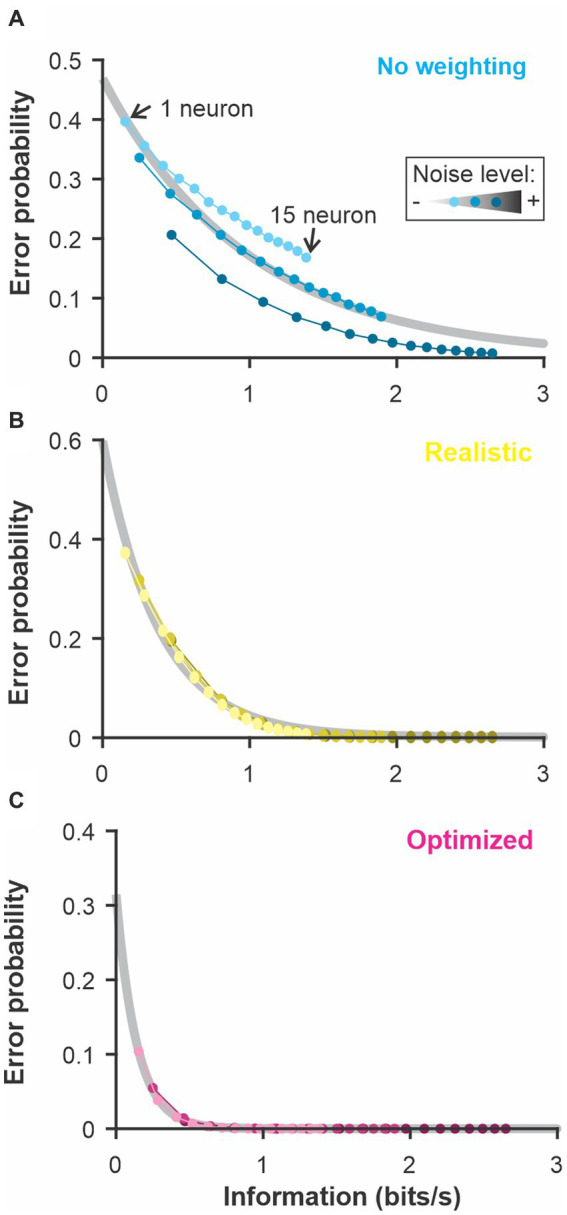
Figure 7.

The discrimination error probability is proportional to the information content of the population. The coding accuracy was calculated for this population of LIF neurons using information-theoretic tools. Using the same neurons and stimuli, we calculated the discrimination accuracy (error probability) using the 3 methods described in Figure 6: (A) constant weights across neurons and time points; (B) weights fixed across time and neural responses averaged across neurons before comparison; (C) weight optimized independently across neurons and time points and all the dimensions kept separate. The number of neurons included in the analysis was varied as in previous figures (the different points along each curve here) and the noise in the LIF model was set to 3 different levels (varying shade). The exponential relationship between error and the information content (grey best-fit lines) shows the high correlation between these two measures of coding accuracy (adjusted R-square > 0.98 for B and C).
