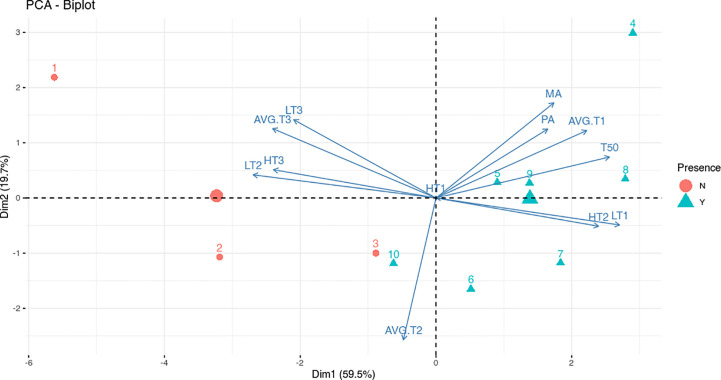
Figure 3.
Biplot for the principal component analysis (PCA) of meteorological data and infection analyses. Red dots indicate sowings that did not show disease (N) while blue triangles indicate sowings that showed disease (Y). The numbers indicate sowings while the red dot and the blue triangle with no number indicate the group centroid. The arrows indicate the contribution of variables to the two axes of the PCA: number of days at Highest Temperature (HT), Lowest Temperature (LT) and Average Temperature (AVG.T); Molecular Analysis (MA) and Phenotypical Analysis (PA) percentages and median germination time (T50). The temperature ranges considered are indicated on arrows variables with 1, 2 or 3 (1: -5/5°C; 2: 5/15°C; 3:15/25°C).

