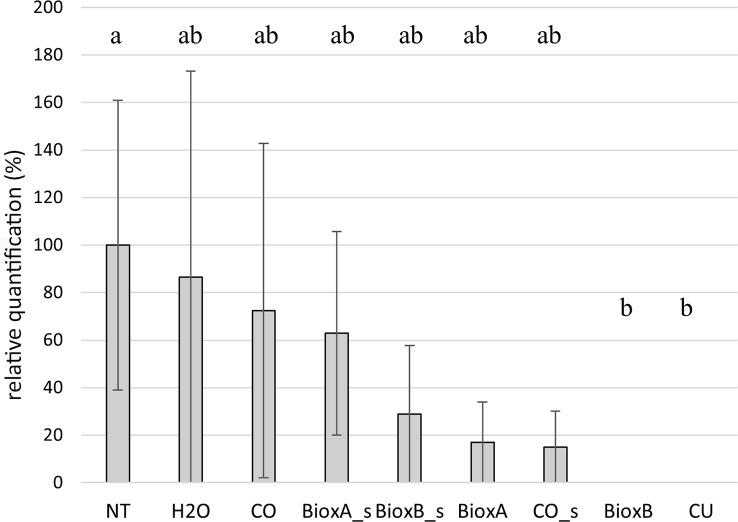
Figure 8.
Barplot of season 2022. Relative quantification, expressed as percentage referring to NT as 100%, is reported on the y-axe. The values obtained from the different treatments are the mean of three replications (± standard error). Significant differences (p = 0.01) found using the LSD test for multiple comparison are indicated as letters a–b; the same letter means no statistical significance. NT, Not treated; H2O, water; CO, clove oil; BioxB, Bioxeda B; BioxA, Bioxeda A; s, spray treatment; CU, Cutril®.

