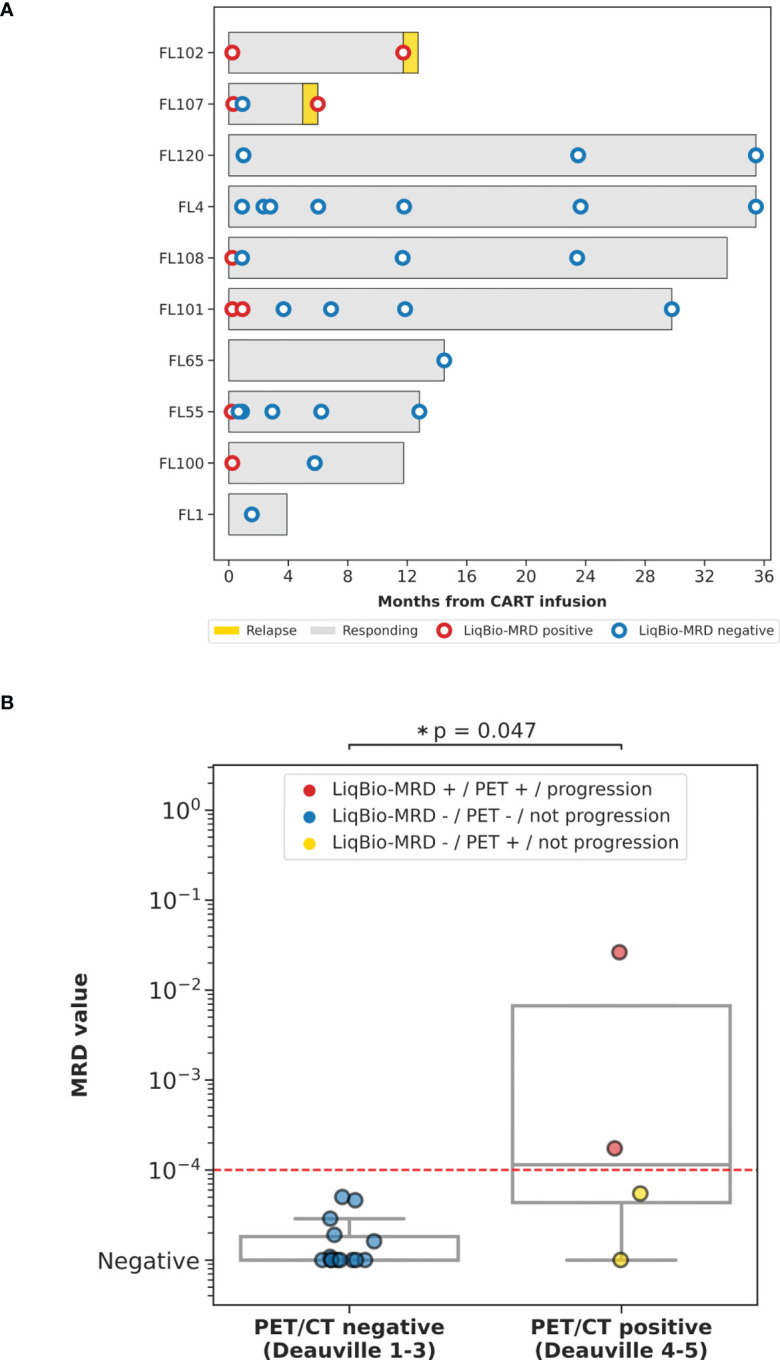
Figure 2.

(A) Swimmer plot of the different follow-up time-points screened for all patients under CART treatment. (B) Correlation of Liqbio-MRD and PET/CT. The CR group included follow-ups with a D5PS of 1, 2, or 3 in nodal or extranodal sites with or without a residual mass. The non-CR group included PR cases with D5PS of 4 with reduced uptake compared with baseline and residual mass(es), and PD cases with a D5PS of 5 in any lesion with increased intensity of the 18F-FDG uptake from baseline * indicates p-value ≤ 0.05.
