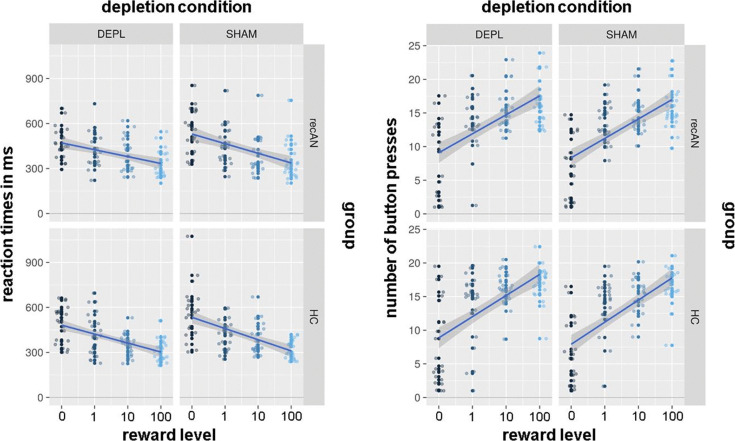
Fig. 2.
Behavioral data of both groups during both conditions. Each dot represents the mean value of one participant for each reward level (0, 1, 10, 100). The left panel shows the distribution of reaction times and the right one the number of button presses (plus smooth regression lines). DEPL = acute tryptophan depletion; SHAM = sham depletion; recAN = individuals with a history of AN; HC = healthy control participants.

