
Fig. 4. Global and regional mean absolute differences in AHEI component scores in children (top) and adults (bottom) in 2018, by high versus low education level.
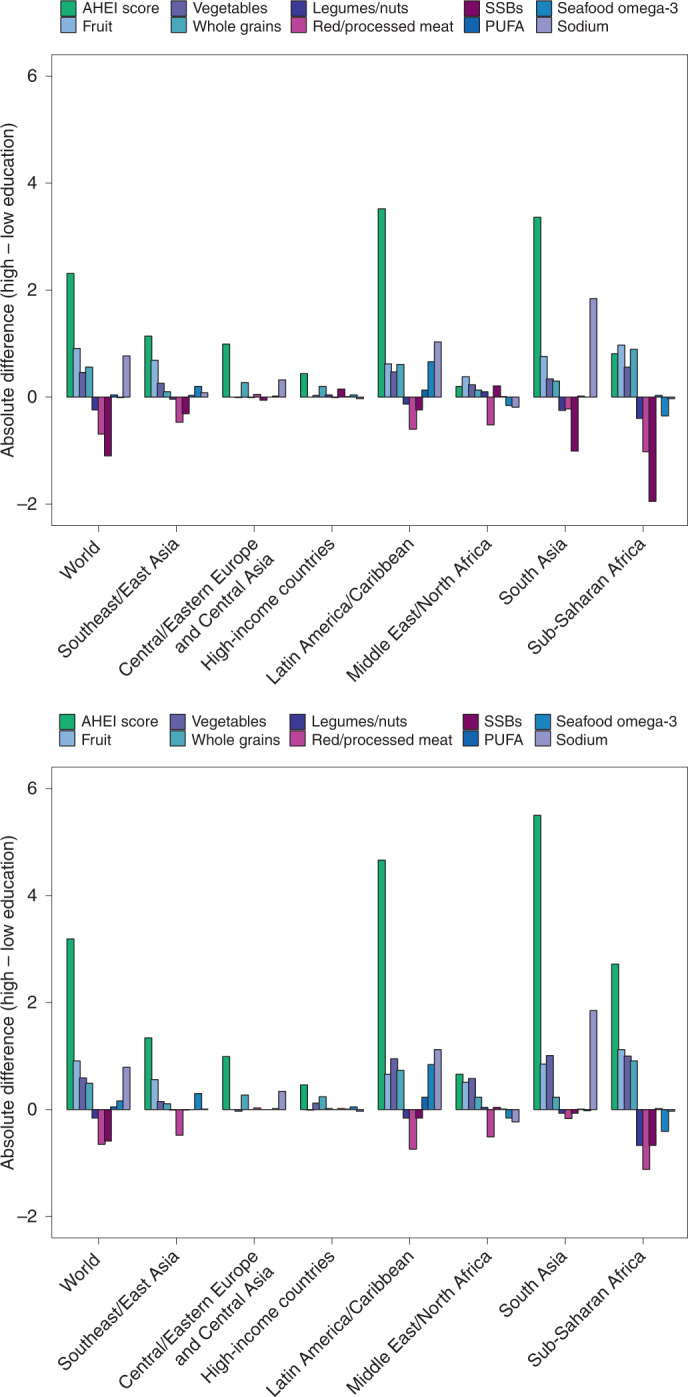
AHEI score: nine components scored from 0 to 10 each and scaled to ten components (correction not shown). The absolute difference by education was computed as the difference at the stratum level and aggregated to the global and regional mean differences using weighted population proportions for low (<6 years) and high education levels (≥12 years) only (excludes education level ≥6 and <12 years).