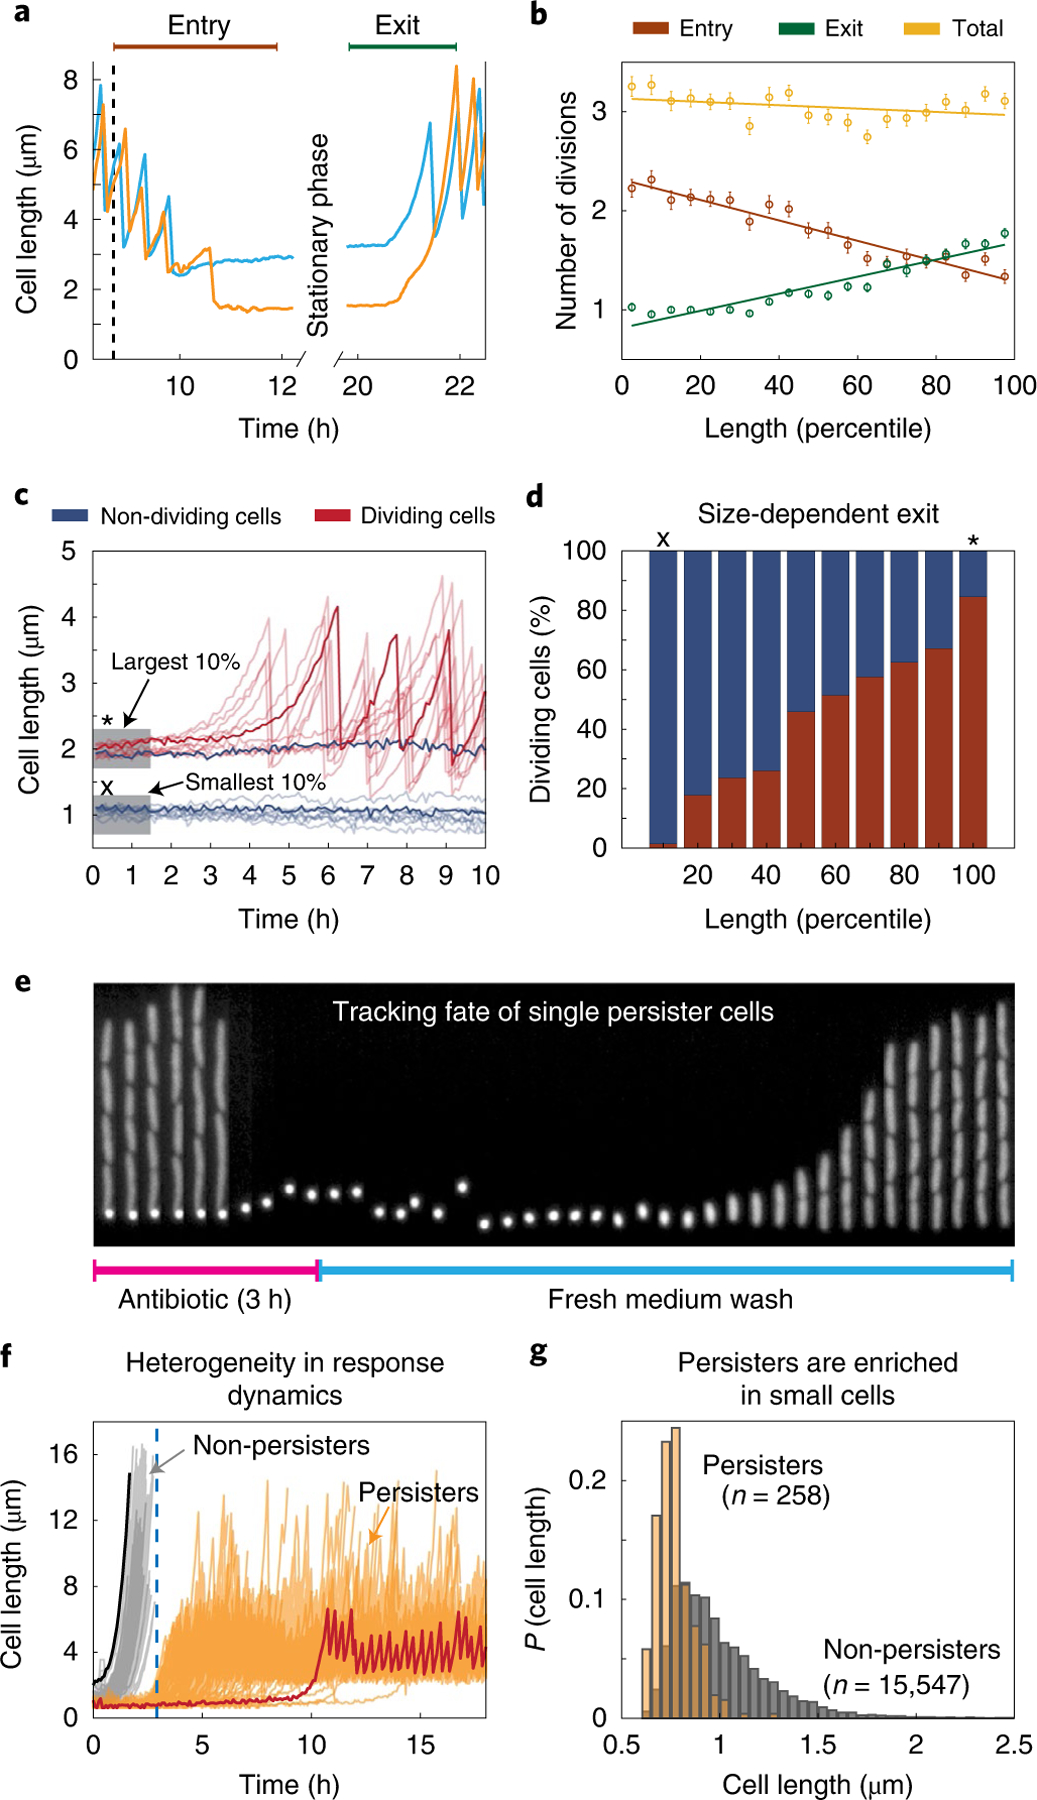
Fig. 4 |. Stationary phase length distribution and survival of deep stationary phase.

a, Two sample traces highlight the differing number of divisions performed during entry and exit for large (blue) and small (orange) stationary phase cells. b, The number of divisions performed during entry (brown), exit (green) and in total from entry through exit (yellow) are plotted against stationary phase cell size binned by percentile. The mean values are plotted with error bars (s.e.m.) and a linear regression line is fit to these points. c, Cells were subjected to a stationary phase lasting one week before being provided with fresh medium. Cell length time traces for ten example cells that exited from deep stationary phase are plotted in translucent red and a sample trace is overlaid in opaque red. Traces in blue show cell length of a sample of 10 cells that did not begin dividing within 10 h of receiving fresh medium. d, The percentage of cells of a given size that began dividing within 10 h (red) and the percentage that never began dividing (blue). In c and d, x represents the smallest quantile and * marks the largest quantile. e, Kymograph showing a channel containing persister mother cells during antibiotic treatment and recovery. f, Sample traces of 258 persister cells (orange) and non-persisters (cells that chain and die during ampicillin treatment; grey). The largest (black) and smallest (red) cells in the population are highlighted. Larger cells tend to exit more quickly and are therefore vulnerable to ampicillin treatment, whereas smaller cells exit stationary phase later and survive. The blue dashed line represents the timepoint where the media was switched to antibiotic-free rich growth medium. g, Distribution of cell sizes in stationary phase for cells that eventually become persisters in stationary phase (orange) compared with the overall population (grey). Each population has been normalized independently.
