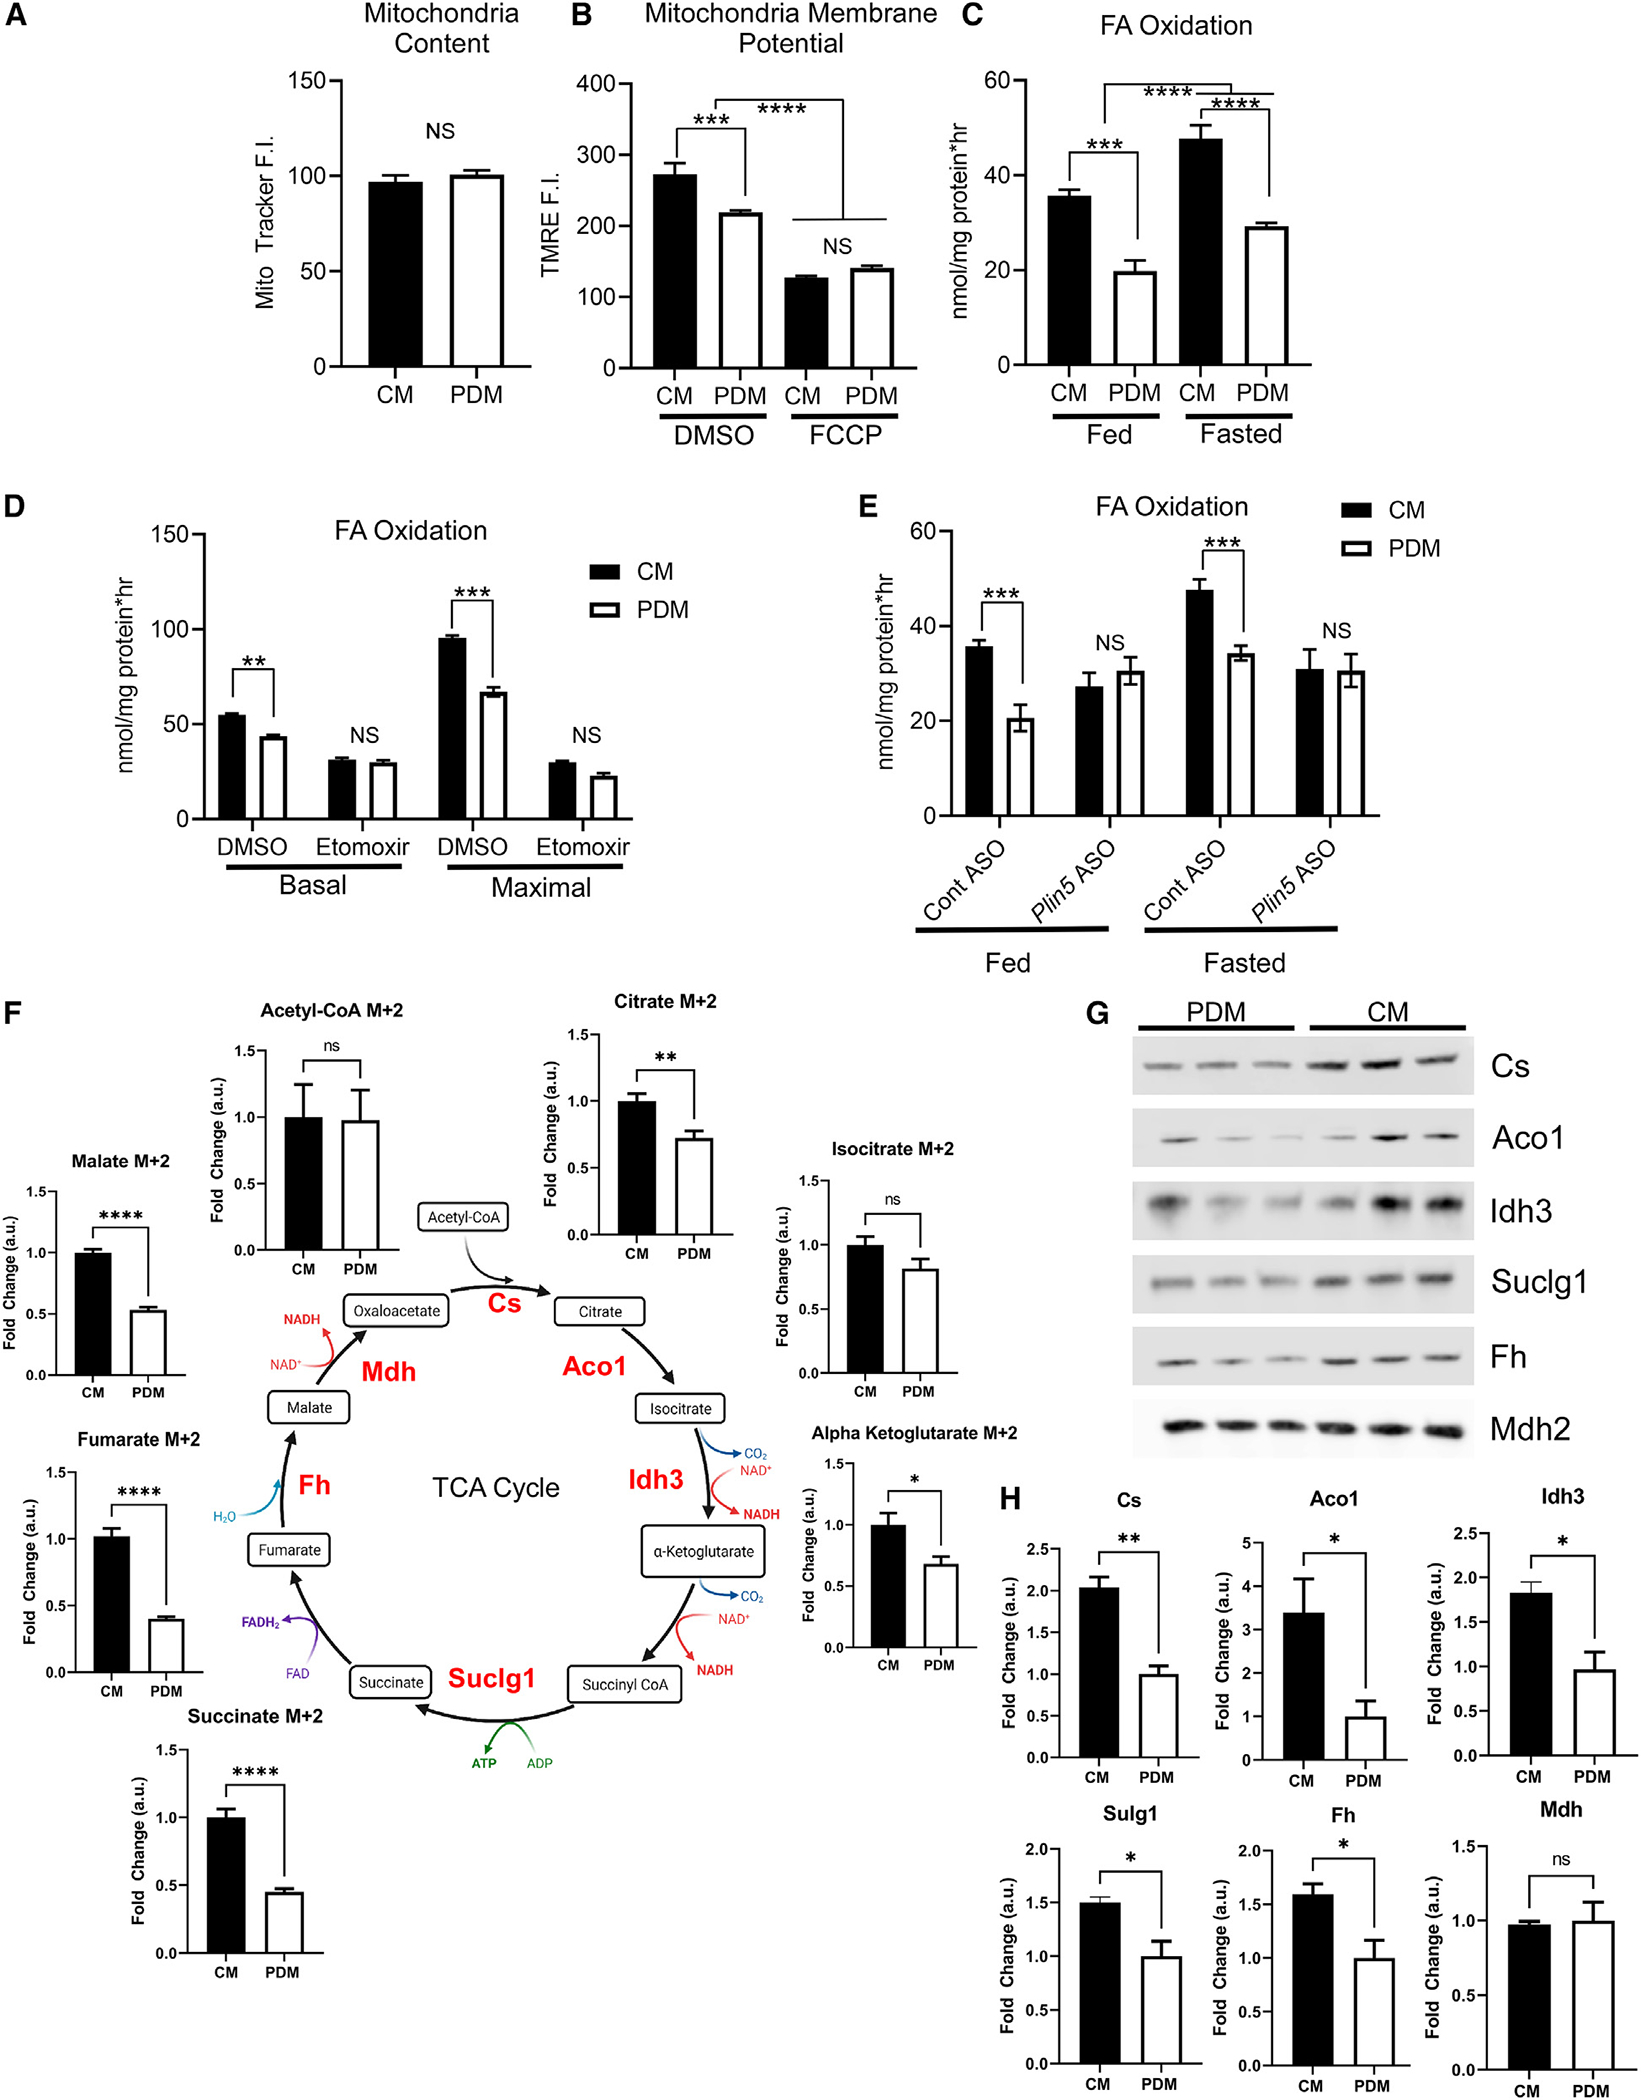
Figure 2. CM have enhanced bioenergetic capacity.

(A) Quantification of MitoTracker Deep Red fluorescence intensity (F.I.) of isolated CM or PDM to ensure equal mitochondrial content. 12–16 wells were quantified per condition and repeated on three independent isolations.
(B) Quantification of TMRE F.I. in control and FCCP-treated mitochondrial fractions; 12–16 wells, repeated on three independent isolations.
(C) Quantification of mitochondrial FA oxidation using [14C]oleate in mitochondrial fractions isolated from mice in the fed or fasted metabolic state. n = 3.
(D) The FA uptake inhibitor etomoxir was used to ensure the oxidation rates determined from our experimental design were due to mitochondrial FA β-oxidation. Shown is quantification of FA oxidation from PDM and CM fractions treated with DMSO or etomoxir in basal or ADP-stimulated maximal respiration. n = 6 from2 different mitochondrial isolations.
(E) Quantification of mitochondrial FA oxidation for CM and PDM isolated from control or PLIN5 KD animals in the fed or fasted metabolic state. n = 4 mitochondrial fractions isolated from independent mice.
(F) TCA cycle intermediates were analyzed by MS from PDM and CM treated with [13C]palmitate as the fuel source. Metabolite intermediates enriched in [13C] were quantified and expressed relative to CM. Shown is a schematic of the TCA cycle with the detected metabolites and the fold change between PDM and CM.
(G) Mitochondrial fractions were analyzed by SDS-PAGE and immunoblotting to Cs, Aco1, Idh3, Suclg1, Fh, and Mdh2. Samples normalized to Ponceau S are shown in Figure S1F.
(H) Quantification of immunoblots depicted in (H) relative to total protein loading.
ns, p > 0.05; *p < 0.05; **p < 0.01; ***p < 0.001; ****p < 0.0001.
