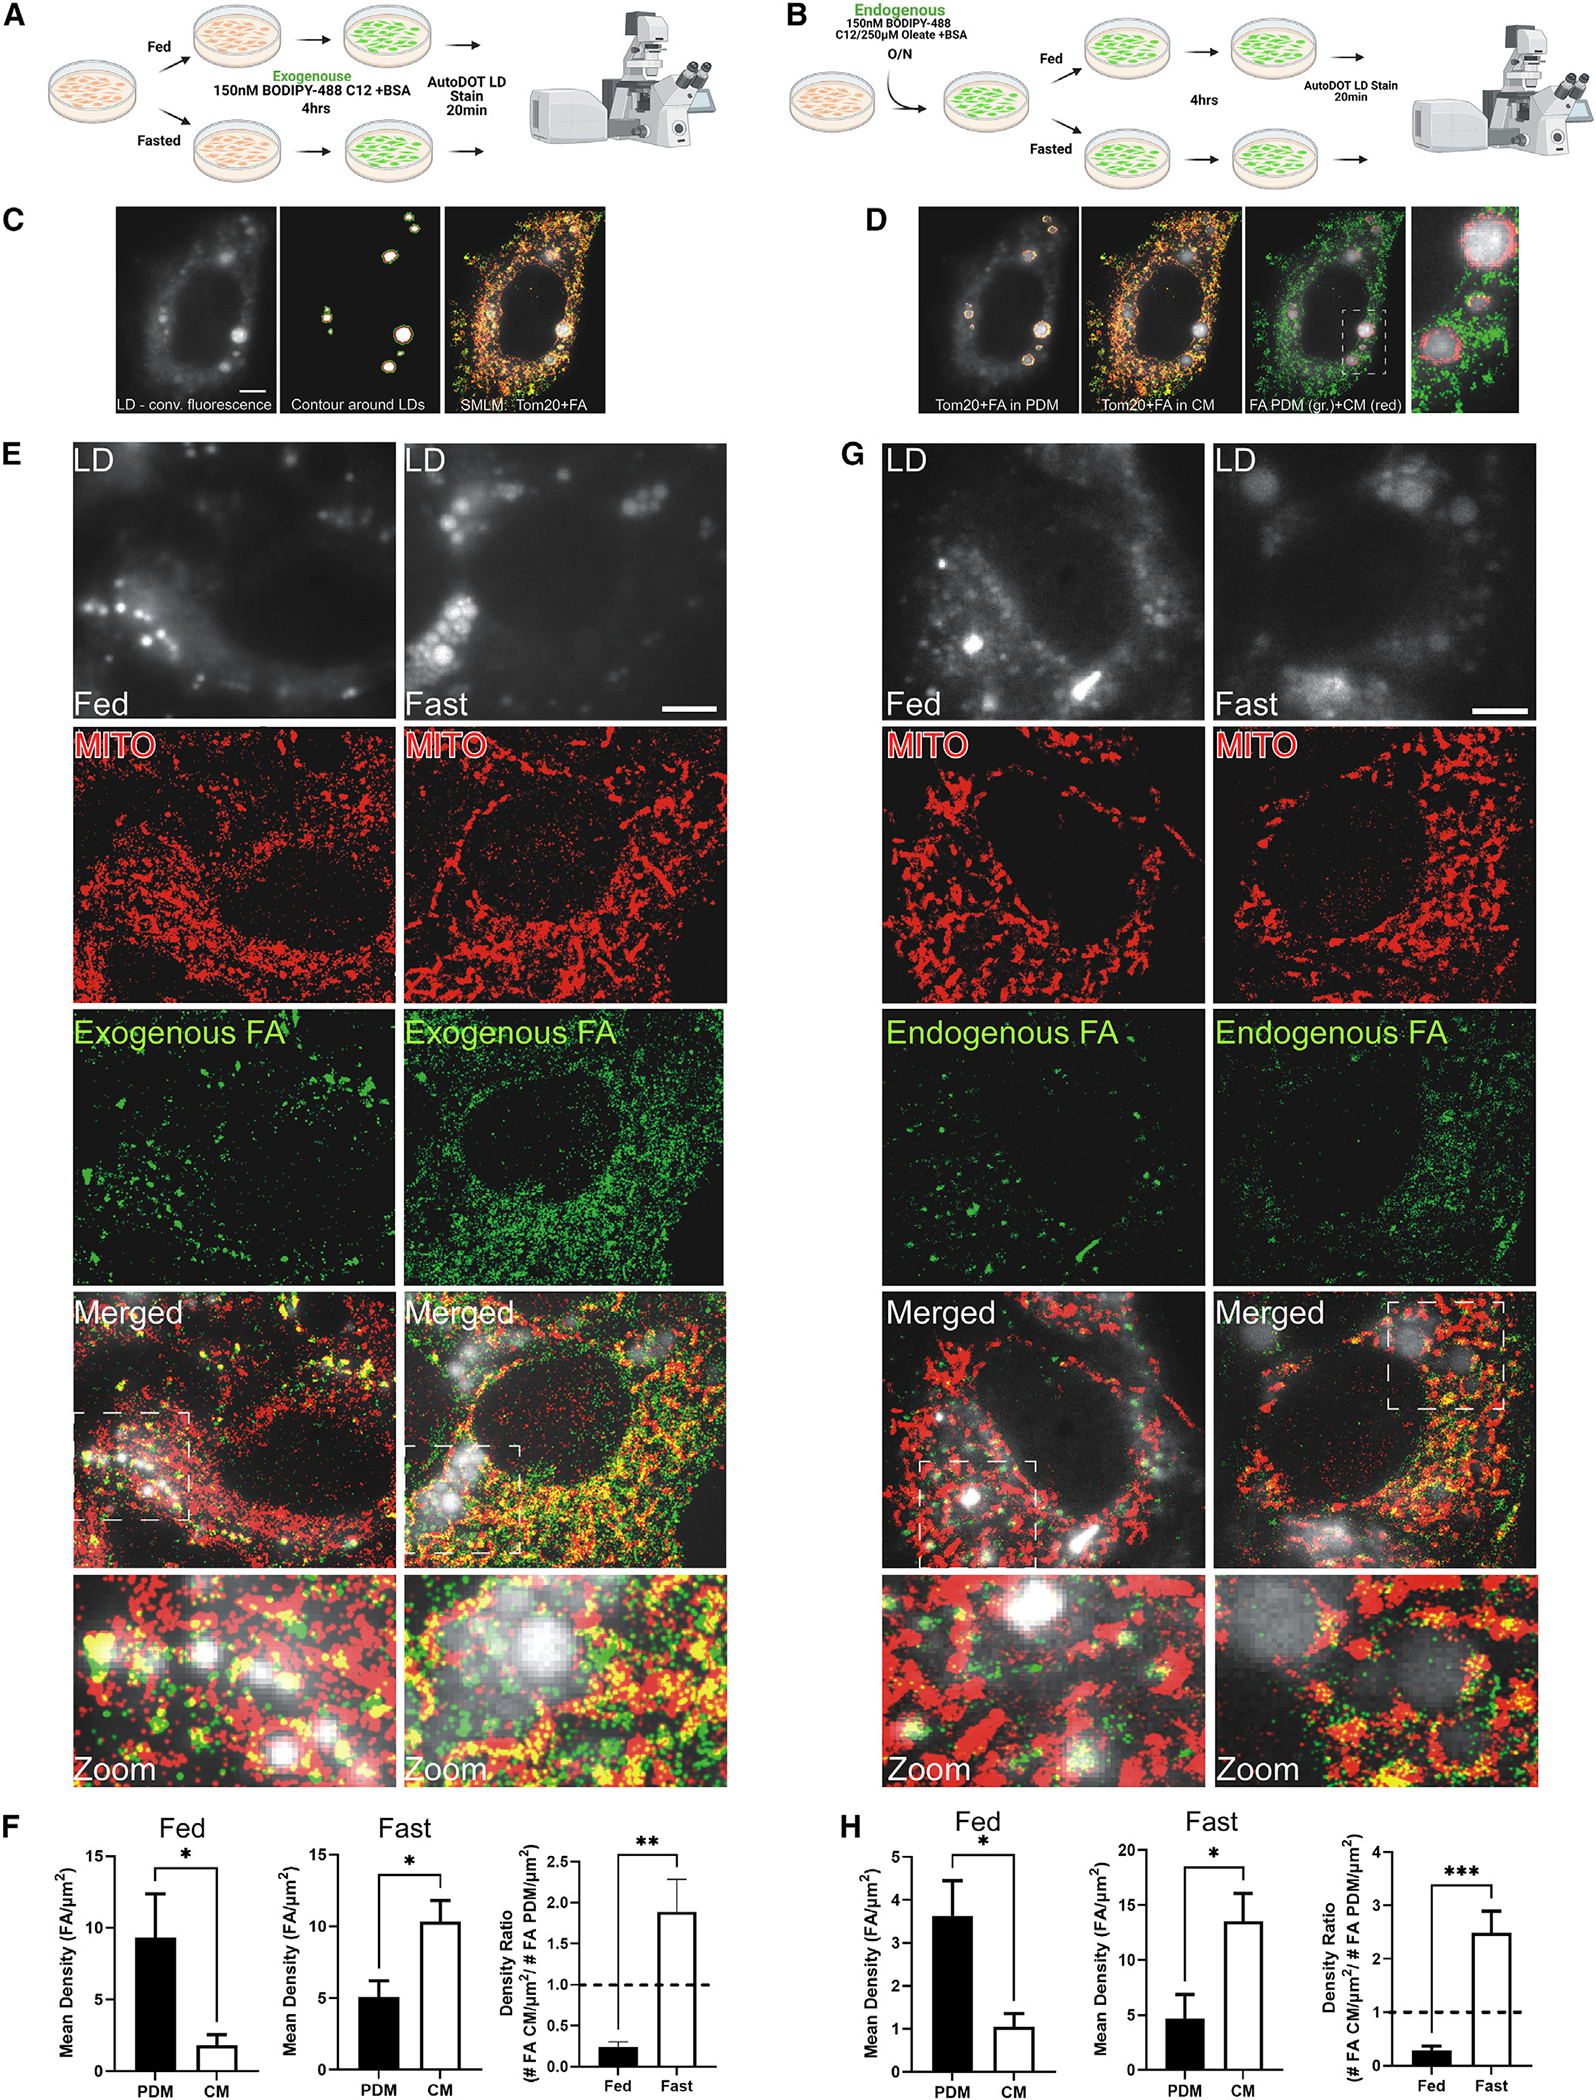
Figure 3. SMLM quantifies differential FA trafficking to CM and PDM dependent on metabolic state.

(A and B) Schematic of the experimental design for exogenous (A) or endogenous (B) FA tracing for SMLM experiments.
(C) Left: conventional fluorescence image of LDs in mammalian cells stained with the AutoDOT dye. Center: to discriminate CM from PDM, binary masks are created by thresholding the conventional fluorescence image of LDs. The depicted scaled contour of the binary LD signal is used to identify the mitochondrial fluorescence signal in proximity to LDs as PDM (red line, LD boundary; green line, PDM boundary). Right: two-color SMLM image of BODIPY-C12 (green) and Tom20-HaloTag JF646 localizations (red) superimposed on the conventional fluorescence LD signal.
(D) Left: BODIPY-C12 and Tom20-HaloTag JF646 localizations in PDM as identified by the scaled LD contour. Center: BODIPY-C12 and Tom20-HaloTag JF646 localizations in CM. Right: super-imposed SMLM image of BODIPY-C12 localizations in PDM (red) and BODIPY-C12 localizations in CM (green). Magnification: BODIPY-C12 in PDM and CM around an LD cluster. Scale bar, 5 μm.
(E) Exogenous FA tracing experiments; top to bottom: conventional fluorescence image of LDs stained with AutoDOT dye under fed (left) and fasted (right) conditions. SMLM image of mitochondria labeled with Tom20-HaloTag JF646. Shown are super-resolution images of the FA analog BODIPY-C12 under fed (left) and fasted (right) conditions and super-imposed SMLM images of Tom20-HaloTag JF646 and BODIPY-C12 localizations on top of conventional LD fluorescence images under fed (left) and fasted condition (right). Magnifications depict Tom20 and FA distribution around clustered LD regions. Scale bar, 5 μm.
(F) Quantification of the density of exogenous BODIPY-C12 FAs in PDM and CM in fed (left) and fasted (center) cells and the FA density ratio of CM/PDM (right).
(G) Endogenous FA tracing experiments as in (C) with the BODIPY-C12 (150 nM) preloaded in LDs overnight with non-fluorescent oleate (250 mM) and switched to fed (left) and fasting medium (right).
(H) Quantification of the density of endogenous BODIPY-C12 FA densities in PDM and CM in the fed (left) and fasted state (center) and FA density ratios of CM/PDM (right).
ns, p > 0.05; *p < 0.05; **p < 0.01; ***p < 0.001.
