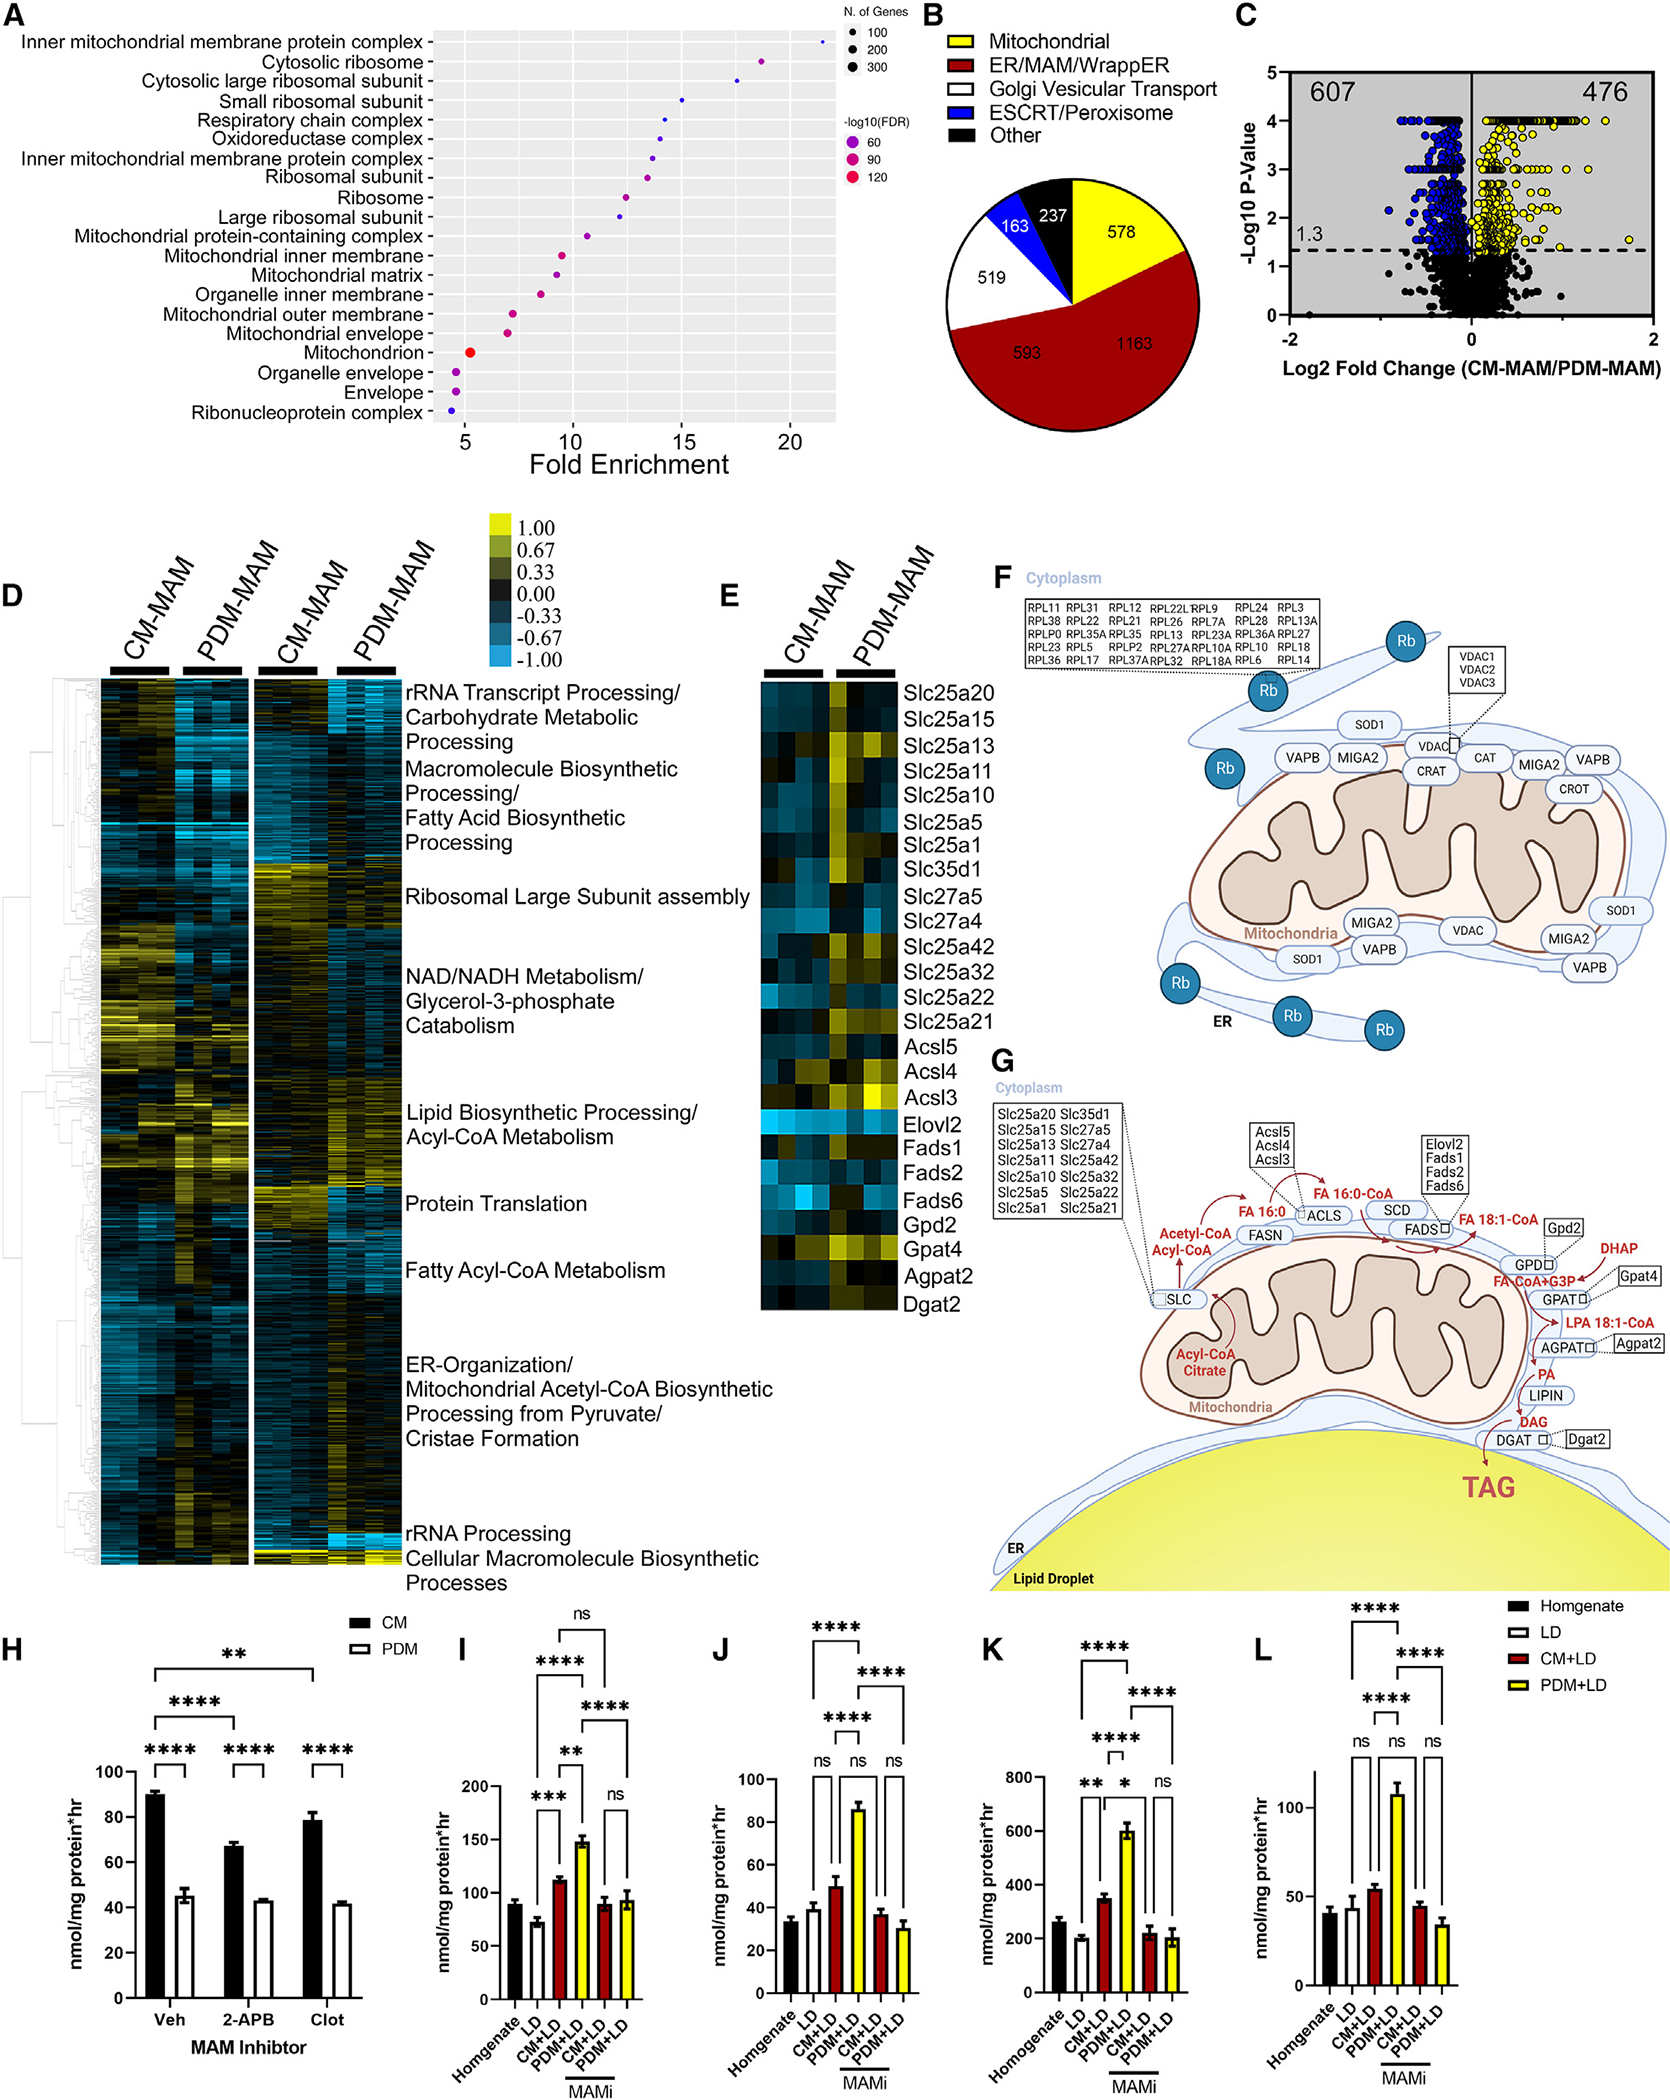
Figure 7. CM and PDM-MAM have unique proteomes that impact mitochondrial function.

(A) Cellular compartment annotation of the entire proteomics dataset, both MAM subpopulations, as determined by GO analysis: cellular component.
(B) Pie charts summarizing the proteomics dataset in bona fide mitochondria, ER proteins, mitochondrion-associated proteins, wrapped ER mitochondrial (WAM) proteins, Golgi apparatus vesicular transport, and ESCRT/peroxisomes.
(C) Volcano plot summarizing the changes in the proteome of CM-MAM and PDM-MAM isolated from livers of overnight-fasted mice (n = 4 MAM fractions isolated from independent mice). Blue indicates proteins that were enriched in the PDM-MAM fractions, while yellow indicates CM-MAM-enriched proteins. Significance was determined using non-parametric quantitative analysis in Scaffold; permutation tests between groups with Benjamini-Hochberg correction (p < 0.006).
(D) Left: hierarchical clustering of proteins significantly different between PDM-MAM and CM-MAM across replicate fractions (threshold for clustered proteins was determined by significance between groups). Right: proteins were further grouped using k-means statistics, breaking the PDM-MAM and CM-MAM significant genes into 10 protein clusters. The clustered proteins were mapped to specific metabolic pathways using Panther classification overrepresentation testing.
(E) Heatmap of lipid incorporation proteins clustered around the GO term with the highest abundance of proteins increased in the PDM-MAM fraction.
(F) Schematic of CM and CM-MAM that depicts pathways with proteins significantly upregulated.
(G) Schematic of PDM and PDM-MAM that depicts pathways with proteins significantly upregulated.
(H) Quantification of FA oxidation from PDM and CM fractions treated with DMSO or 2-APB or clotrimazole (MAM decoupling compounds). n = 5 from 2 different mitochondrial isolations.
(I–L) Quantification of FA incorporation from PDM and CM promoted storage. Fractions were treated with DMSO, 2-APB, or clotrimazole.
Data are expressed as means ± SEM. ns, p > 0.05; *p < 0.05; **p < 0.01; ***p < 0.001; ****p < 0.0001.
