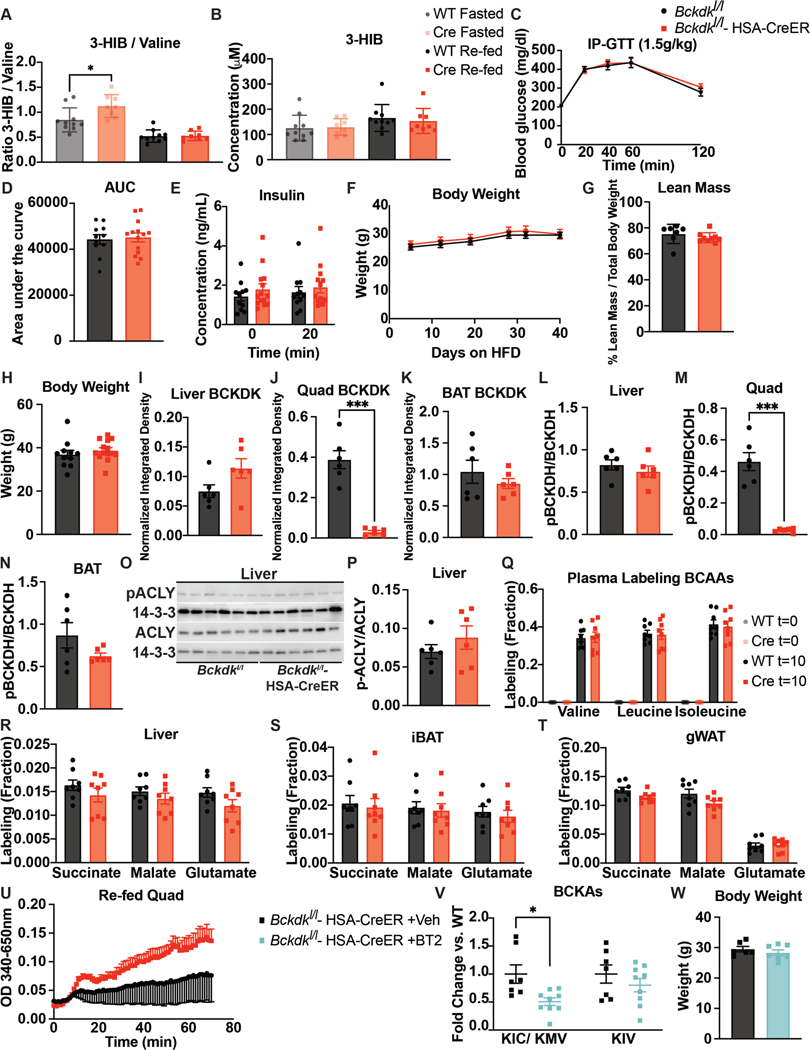
Extended Data Figure 4. Increased BCAA oxidation in BCKDK muscle knockout is specific in a fed state and does not affect body weight or glucose tolerance on HFD.
a, Ratio of 3-HIB/valine, and b, Concentration of 3-HIB in mice fasted for 5-hr or re-fed for 2-hr after an overnight fast; n=10 Bckdkl/l (WT) and n=8 Bckdkl/l-HSA-CreER (Cre). c, 1.5g/kg IP-GTT in 5-hr fasted mice; n=11 WT and n=14 Cre. d, Area-under-the-curve (AUC) for GTT in c. e, Insulin concentration at t=0 and t=20 min (n=11 WT and n=14 Cre) during GTT from c. f, Weights; n=10 WT and n=8 Cre. g, Lean mass; n=7 WT and n=9 Cre. h, Weights; n=11 WT and n=14 Cre. i-k, Quantification of BCKDK in re-fed tissues normalized to loading control. l-n Quantification of the ratio pBCKDH/BCKDH in re-fed tissues. o, Western blotting for p-ACLY&ACLY in re-fed livers. 14-3-3 is the loading control. p, Quantification of the ratio p-ACLY/ACLY. n=6 WT and n=6 Cre for i-p. q, Labeling fraction of BCAAs in plasma before (t=0) and 10 min after gavage (t=10) of U13C-BCAAs in mice re-fed for 2-hr, and labeling fraction of TCA cycle intermediates 10 min after gavage of U13C-BCAAs in re-fed r, liver, s, iBAT, and t, gWAT; n=8 WT and n=8 Cre. u, BCKDH activity in re-fed quads; n=4 WT and n=3 Cre. v, Plasma BCKAs in Bckdkl/l-HSA-CreER mice treated with 100mg/kg of vehicle (Veh; n=6) or BT2 (n=7) the night before and morning of collection. w, Weights of Bckdkl/l-HSA-CreER mice treated with Veh or BT2. Mice in a, b, & f were male, aged 14–24 weeks and fed HFD for 4–5 weeks. Mice in c-e, & h were male, aged 20–26 weeks and fed HFD for 10 weeks. Mice in g & l-u were male, aged 16–17 weeks and fed HFD for 4 weeks. Mice in v & w were male, aged 12–20 and fed HFD for 4 weeks. Comparisons of two groups use two-tailed Student’s t-test with significance defined as: *p<0.05, **p<0.01, ***p<0.001. Experiments with multiple comparisons at different time-points use two-way ANOVA with repeated measures.

