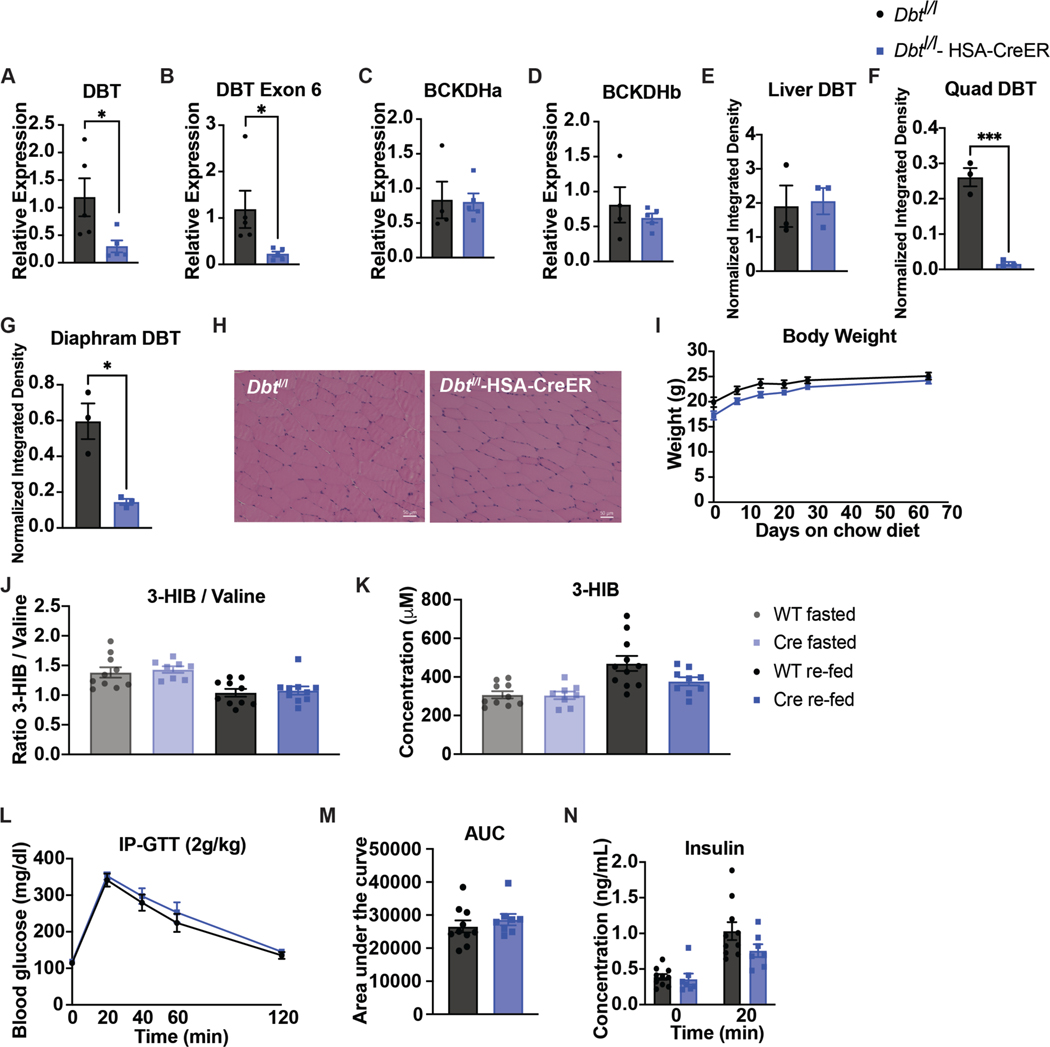
Extended Data Figure 5. DBT muscle knockout is specific and does not affect body weight, muscle physiology, or glucose tolerance on chow diet.
a-d, Gene expression data via qPCR of Dbt, Dbt exon 6 (deleted region), Bckdha, and Bckdhb, respectively; n=3 Dbtl/l (WT) and n=5 Dbtl/l-HSA-CreER (Cre). e-g, Western quantification of DBT in fasted tissues normalized to loading control; n=3 WT and n=3 Cre. h, H&E staining of tibialis anterior (TA) muscle. Representative images from n=3 WT and n=3 Cre. I, Ratio of 3-HIB/valine, and j, Concentration of 3-HIB from mice fasted for 5-hr (n=10 WT and n=8 Cre) or re-fed for 2-hr after an overnight fast (n=11 WT and n=9 Cre). k, Body weights; n=10 WT and n=8 Cre. l, 2g/kg glucose IP-GTT in 5-hr fasted mice; n=10 WT and n=10 Cre. m, Area-under-the-curve (AUC) for the GTT in l. n, Insulin concentration at t=0 and t=20 min (n=10 WT and n=7 Cre) during GTT from l. Mice used in these experiments were male, aged 10–19 weeks fed chow diet. Comparisons of two groups use two-tailed Student’s t-test with significance defined as: *p<0.05 and ***p<0.001. Experiments with multiple comparisons at different time-points use two-way ANOVA with repeated measures.

