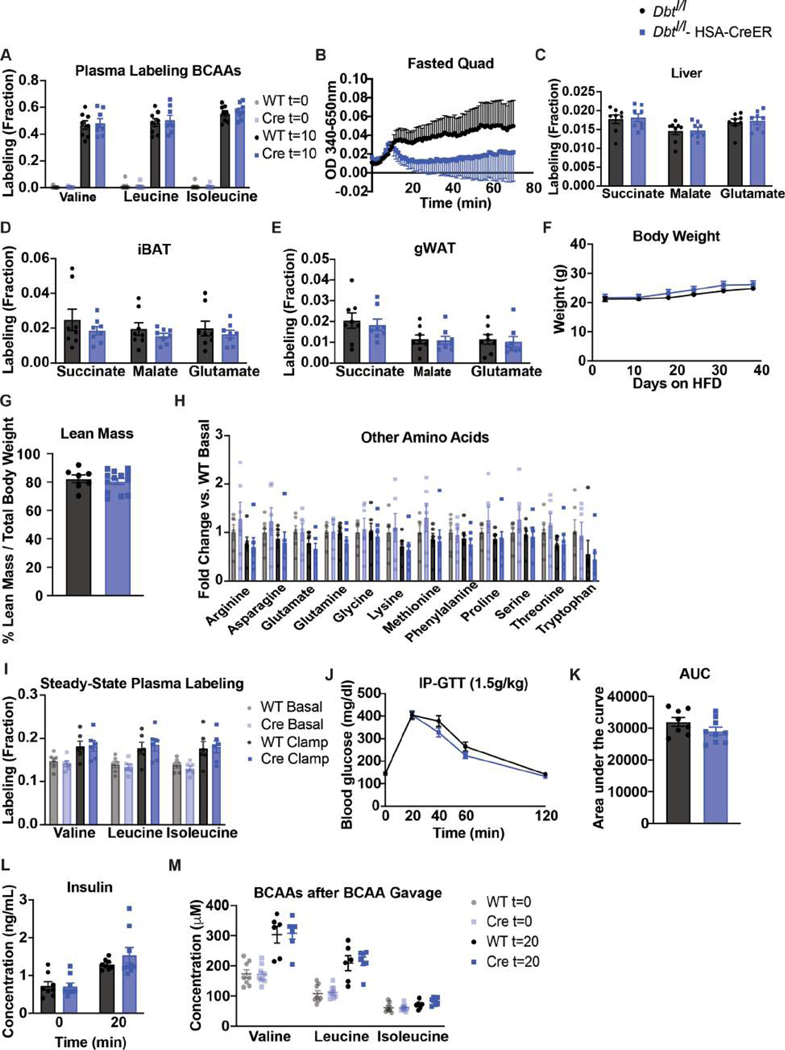
Extended Data Figure 6. Decreased BCAA oxidation in DBT muscle knockout is muscle specific and does not affect body weight or glucose tolerance on HFD.
a, Plasma labeling of BCAAs after U13C-BCAAs gavage (fraction) in 5-hr fasted mice; n=8 Dbtl/l (WT) and n=8 Dbtl/l-HSA-CreER (Cre). b, BCKDH complex activity measured in fasted quads from n=4 WT and n=4 Cre mice. Labeling fraction of TCA cycle intermediates 10 min after gavage of U13C-BCAAs in c, liver d, iBAT, & e, gWAT in 5-hr fasted mice; n=8 WT and n=8 Cre. f, Body weights; n=10 WT and n=14 Cre. g, Lean mass; n= WT and n= Cre. Fasting plasma pool size of various amino acids during steady-state infusion of U13C-BCAAs before (basal, 5-hr fasted) and during (clamp, 7-hr fasted) HIEC in n=6 WT and n=6 Cre mice. h, Plasma BCAA concentration in 5-hr fasted or 2-hr re-fed after an overnight fast in mice; n=8 WT and n=10 Cre. i, Steady-state plasma labeling of BCAAs by infusion of U13C-BCAAs before (basal) and during (clamp) HIEC; n=6 WT and n=6 Cre mice fed. j, 1.5g/kg glucose IP-GTT in 5-hr fasted mice fed HFD for 4 weeks; n=8 WT and n=9 Cre. k, Area-under-the-curve (AUC) for the GTT in j. l, Insulin concentration at t=0 and t=20 min (n=8 WT and n=9 Cre) during the GTT from j. m, Plasma BCAA concentration in 5-hr fasted mice before (t=0), n=8 WT and n=9 Cre, and 20 min after (t=20), n=6 WT and n=7 Cre, a gavage of BCAAs. Mice used in these experiments were male, aged 10–20 weeks fed HFD for 4–8 weeks. Comparisons of two groups use two-tailed Student’s t-test. Experiments with multiple comparisons at different time-points use two-way ANOVA with repeated measures.

