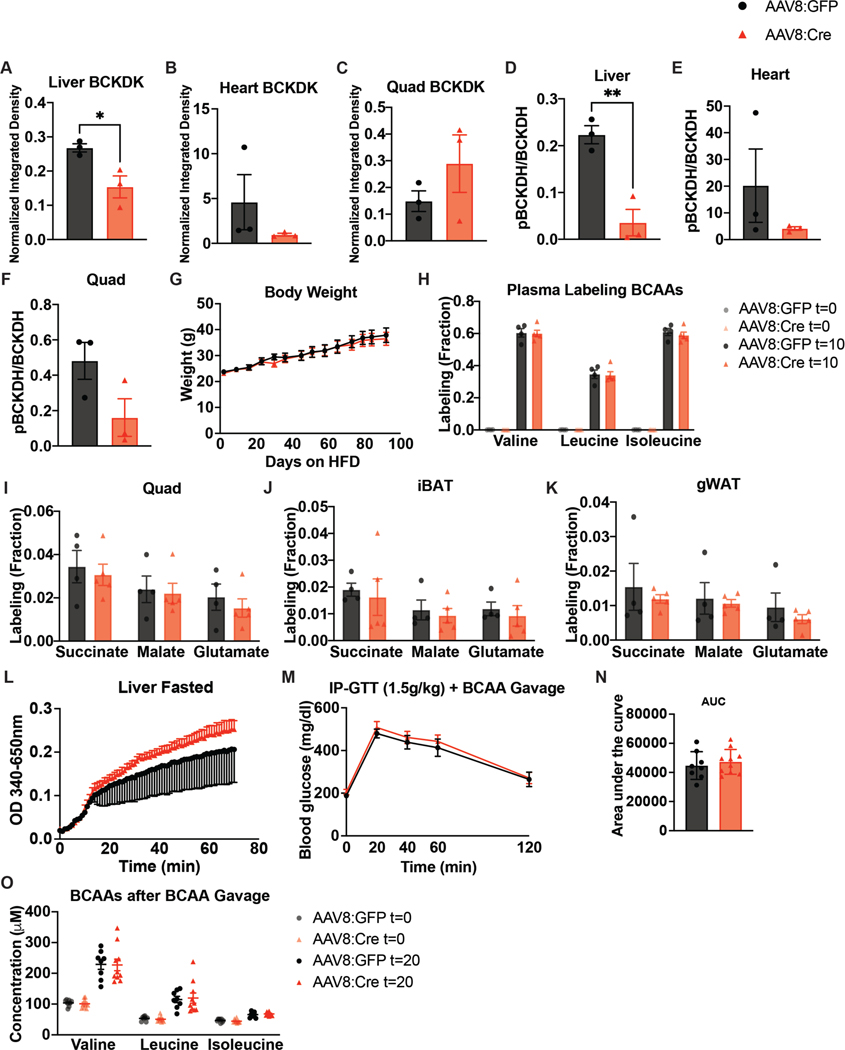
Extended Data Figure 7. BCKDK liver knockout does not affect body weight or glucose tolerance at various time points on HFD or after a BCAA challenge.
a-c, Western quantification of BCKDK in tissues normalized to loading control; n=3 Bckdkl/l-AAV8:GFP (GFP) and n=3 Bckdkl/l-AAV8:Cre (Cre). d-f, Western quantification of the ratio pBCKDH/BCKDH; n=3 GFP and n=3 Cre. g, Body weights of n=9 GFP and n=10 Cre mice on HFD. h, Plasma labeling of BCAAs after U13C-BCAAs gavage (fraction) 5-hr fasted mice; n=4 GFP and n=5 Cre. Labeling fraction of TCA cycle intermediates 10 min post U13C-BCAA gavage in i, quad j, iBAT, & k, gWAT in 5-hr fasted mice; n=4 GFP and n=5 Cre. l, BCKDH complex activity assay measured in fasted livers from n=4 GFP and n=3 Cre mice. m, 1.5g/kg glucose IP-GTT in 5-hr fasted mice fed HFD after a BCAA gavage given at t=0; n=8 GFP and n=10 Cre. n, Area-under-the-curve (AUC) for the GTT in m. o, Plasma BCAA concentration of 5-hr fasted plasma before (t=0) (n=8 GFP and n=9 Cre) and 20 min after (t=20) (n=8 GFP and n=10 Cre) a BCAA gavage from GTT + BCAA gavage in m. Mice used in these experiments were male, aged 8–26 weeks and on a HFD for 2–12 weeks. Comparisons of two groups use two-tailed Student’s t-test with significance defined as: *p<0.05 and **p<0.01. Experiments with multiple comparisons at different time-points use two-way ANOVA with repeated measures.

