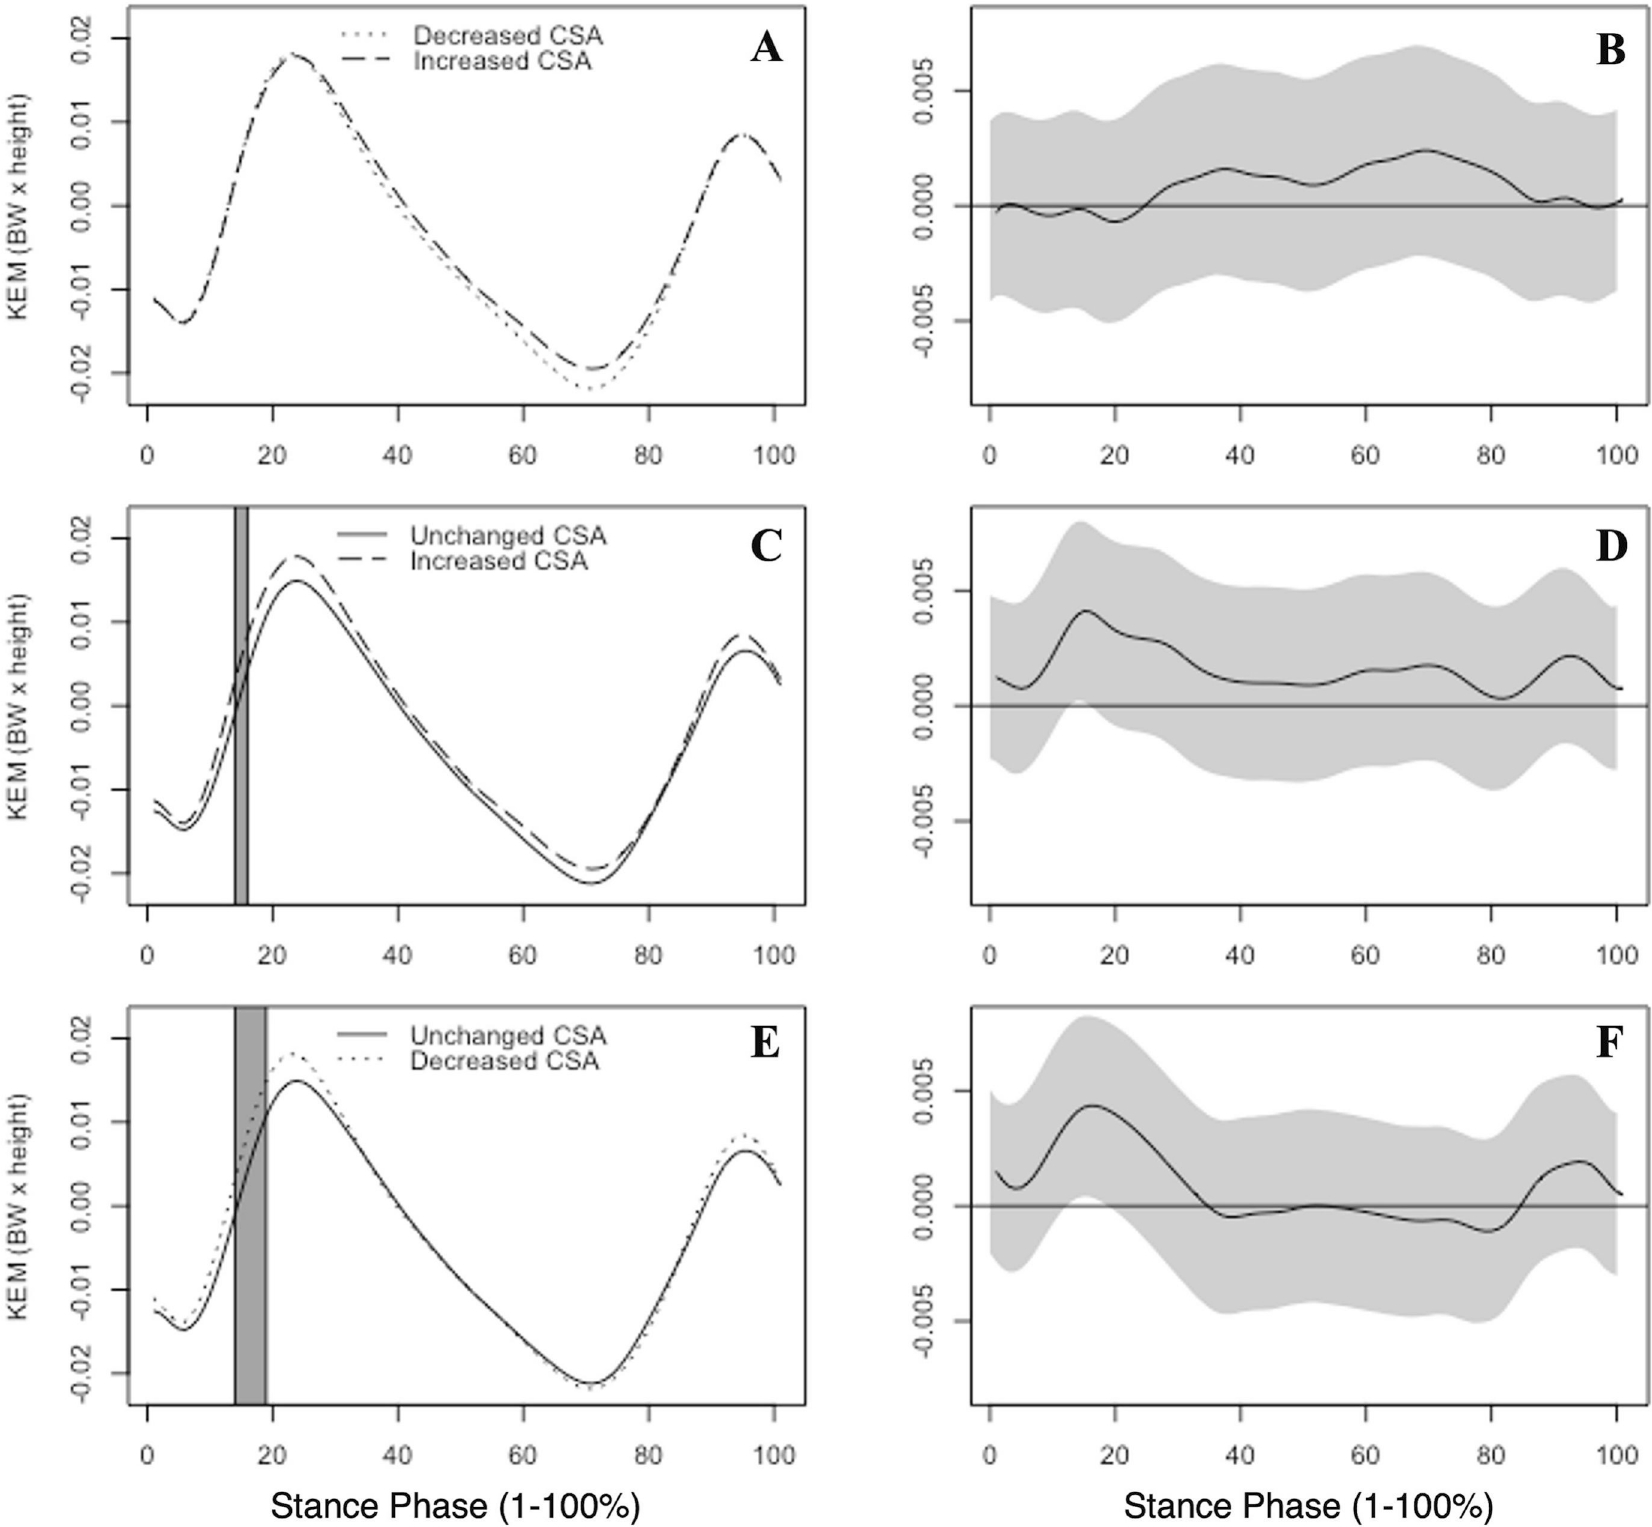
Figure 2.

Group mean internal knee extension moments (KEM), normalized by body weight (BW) and height, are illustrated. KEM is reported by group between the increased and decreased CSA groups (A), unchanged and increased CSA groups (C) and the unchanged and decreased CSA groups (E) across the entirety of stance phase (1–100%). Gray boxes indicate areas where the 95% confidence intervals did not include zero. Corresponding KEM mean differences with associated 95% confidence intervals (grey bands) between groups are shown at right (B,D,F). Positive values indicate greater internal KEM.
