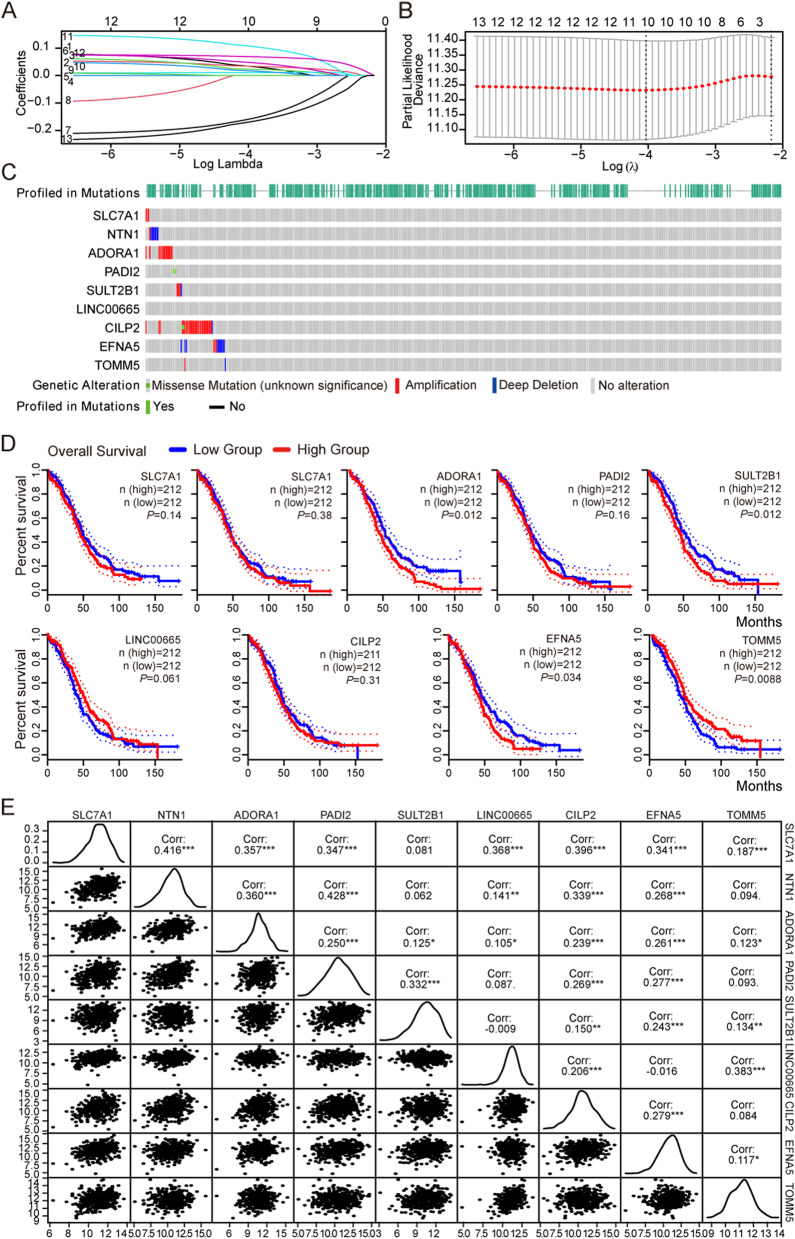
Fig. 5.
Further screen genes by LASSO and correlation study. A LASSO coefficient profiles of the 13 genes in TCGA-OV. Different colors represent different variables (genes). B λ selection diagram. The two dotted lines indicated two particular values of λ. The left side was λmin and the right side was λ1se. The λmin was selected to build the model for accuracy in our study. C Genetic alteration of the 9 genes in the TCGA-OV cohort (cBioPortal). D The prognosis of 9 genes obtained from GEPIA2 database. E Correlation analysis among 9 genes by spearman correlation

