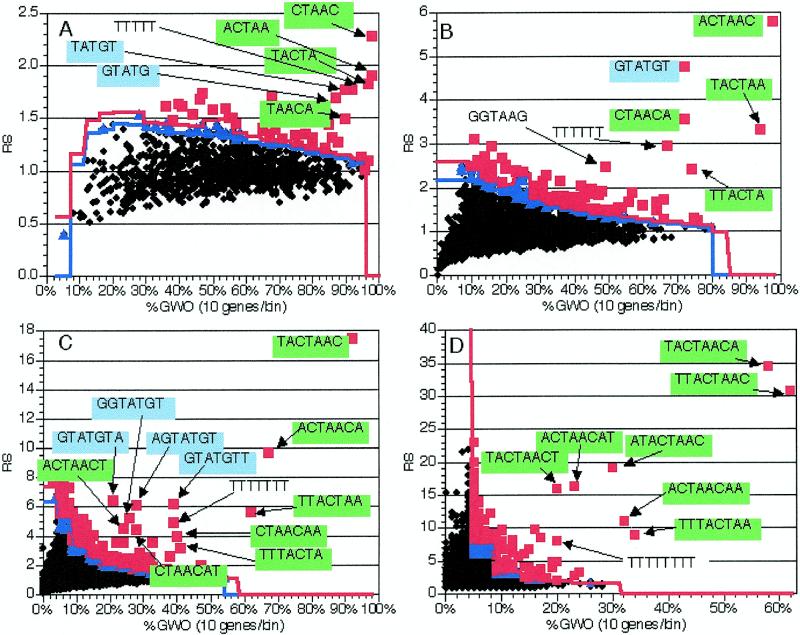
Figure 2.
Application of the method to 225 genes with introns. As described in the text, oligomers were counted and analyzed in the coding region (including introns) of 225 genes containing introns. The coding regions of the genes without introns were used for normalization. 1000 random trials were used to determine significance levels; see text for details. Black diamonds, insignificant oligomers; blue triangles, oligomers significant at P = 0.05; red squares, oligomers significant at P = 0.01. Blue line, P = 0.05 significance cut-off in each bin; red line, P = 0.01 cut-off. Text and arrows indicate the sequences of pertinent over-represented oligomers; green backgrounds indicate oligomers comprising or containing TACTAAC, while blue backgrounds indicate the GTATGT 5′ splice site consensus. RS, representational score; %GWO, percent of genes in group with oligomer. %GWO is obtained by dividing GWO values by the number of genes in the group, 225 in this case. (A) Values from analysis of 5 nt oligomers. (B) Values from analysis of 6 nt oligomers. (C) Values from analysis of 7 nt oligomers. (D) Values from analysis of 8 nt oligomers.

