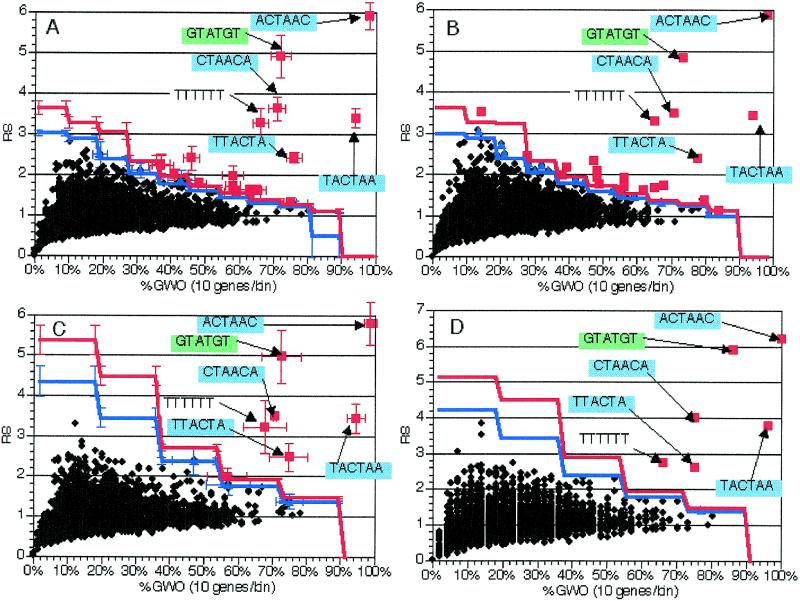
Figure 4.
Effect of small groups on element detection in genes with introns. As described in the text, smaller groups of genes with introns were obtained by discarding randomly selected genes with introns. Plots and experiments are as in Figure 2, with the exception that %GWO is determined by dividing by the appropriate number of genes for each experiment. Sequences are indicated for pertinent oligomers with text and arrows. Error bars indicate standard deviations from 10 independent experiments. All data presented is from analysis of 6 nt oligomers. (A) Average values from analysis of groups of 112 genes with introns. (B) Representative single experiment with a 112 gene group. (C) Average values from analysis of groups of 56 genes with introns. (D) Representative single experiment with a 56 gene group. (E) Average values from analysis of groups of 22 genes with introns. (F) Representative single experiment with a 22 gene group. (G) Average values from analysis of groups of 10 genes with introns. (H) Representative single experiment with a 10 gene group.


