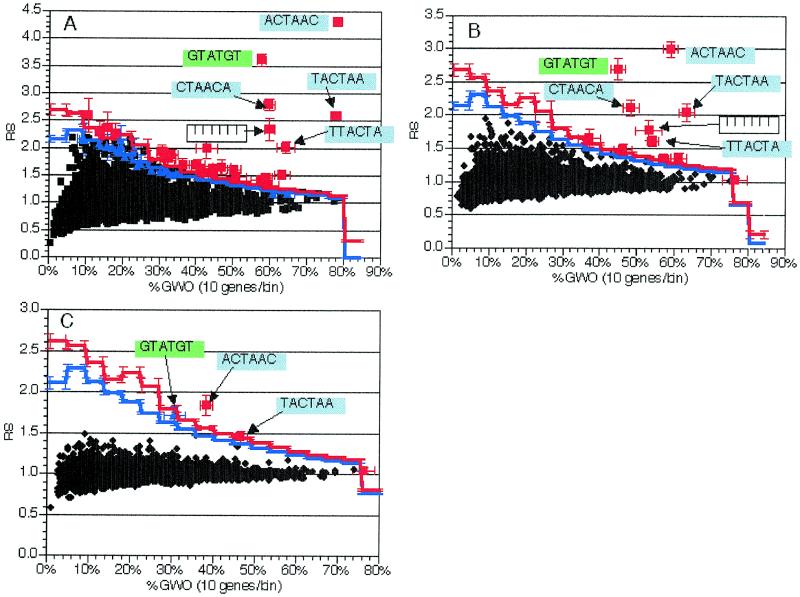
Figure 6.
Effect of group misselection simulation in groups with some intron-containing genes. As described in the text, selection of inappropriate gene groups was simulated by swapping random numbers of genes without introns with genes with introns. Plots and experiments are as in Figure 2. Sequences are indicated for pertinent oligomers with text and arrows. Error bars indicate standard deviations from 10 independent experiments. All data presented are from analysis of 6 nt oligomers in groups of 225 genes. (A) Average values from analysis of groups with 167 genes with introns and 58 without introns (75% introns in set). (B) Average values from analysis of groups with 113 genes with introns and 112 without introns (50% introns in set). (C) Average values from analysis of groups with 57 genes with introns and 168 without introns (25% introns in set).

