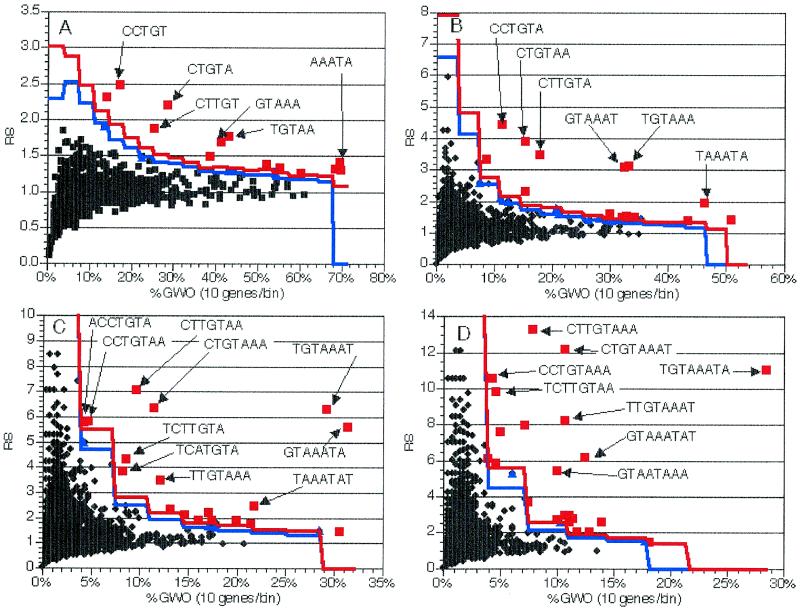
Figure 7.
Application of the method to 281 genes encoding mitochondrially localized proteins. As described in the text, oligomers were counted and analyzed in the 3′-UTR of 281 genes encoding mitochondrial proteins. Plots and experiments are as in Figure 2, with the exception that %GWO values were determined by dividing by 281, to reflect the change in gene group size, and that oligomer backgrounds are not color coded. (A) Values from analysis of 5 nt oligomers. (B) Values from analysis of 6 nt oligomers. (C) Values from analysis of 7 nt oligomers. (D) Values from analysis of 8 nt oligomers.

