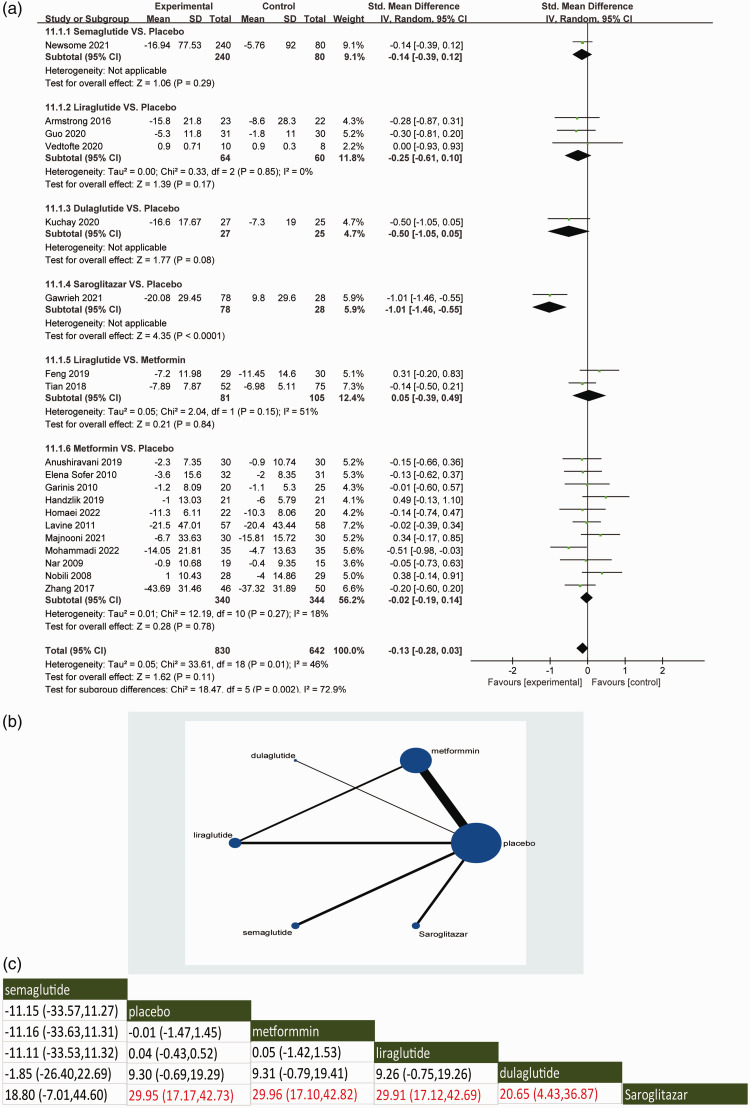
Figure 3.
Direct meta-analysis (a), network graphs (b) and network meta-analysis (c) for the primary outcome of aspartate aminotransferase. In the reticulation diagram (b), the size of the dots represents the number of patients with relevant interventions and the thickness of the wires represents the number of included studies.

