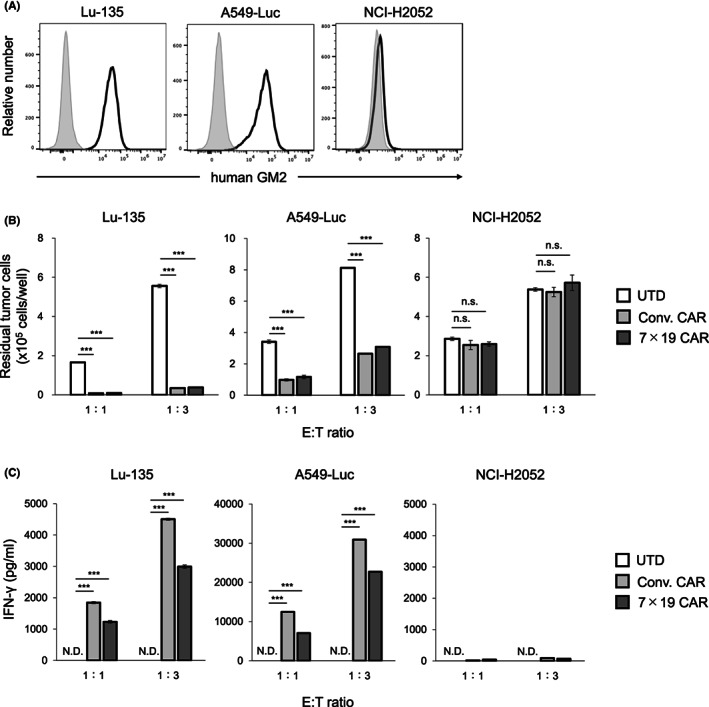
FIGURE 2.

GM2‐specific immune responses of Conv. CAR and 7 × 19 CAR‐T cells in vitro. (A) Surface expression of endogenous GM2 was assessed in human solid cancer cell lines by flow cytometry. Open and filled histograms indicate staining with humanized anti‐GM2 Ab and nonstaining, followed by anti‐human IgG Ab, respectively. (B) Conv. CAR‐T, 7 × 19 CAR‐T, or UTD T cells were co‐cultured with the indicated tumor cells at an effector‐to‐target (E:T) ratio of 1:1 and 1:3 for 2 days. The number of residual tumor cells after co‐culture was analyzed by flow cytometry. Data are shown as mean ± standard error (SE) of triplicate samples. (C) The supernatants of co‐cultured cells as described in (B) were harvested, and the concentration of IFN‐γ was assessed by ELISA. Data are shown as mean ± SE of triplicate samples. ***p < 0.001, N.D., not detected; n.s., not significant.
