
FIGURE 2.
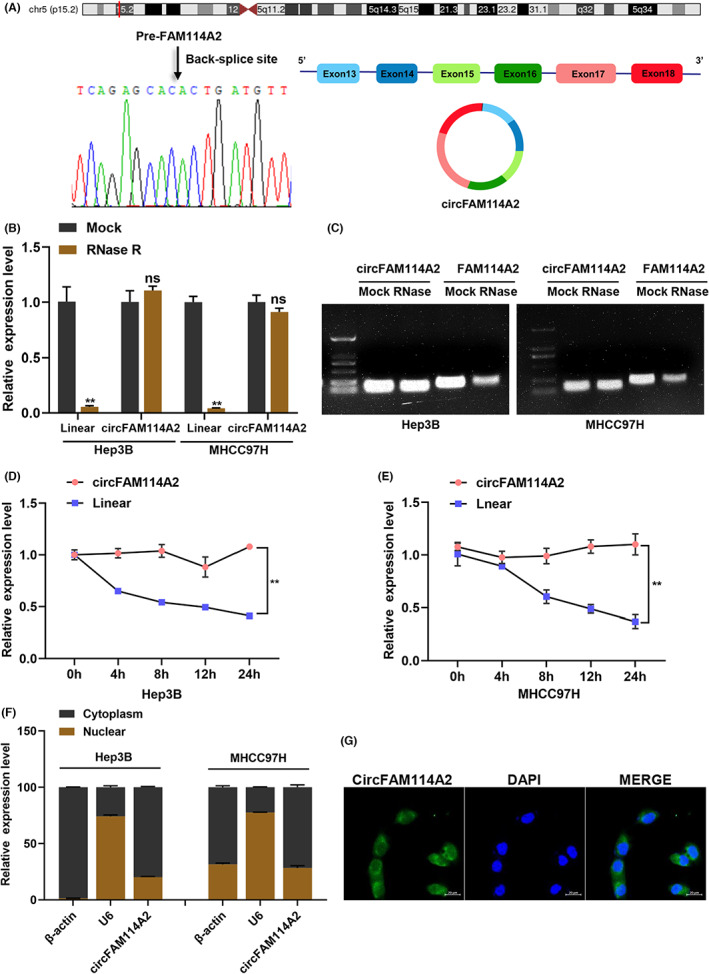
Circularization structure verification of circFAM114A2. (A) Schematic illustration indicating the generation of circFAM114A2 and validated by Sanger sequencing. (B, C) Relative expression of circFAM114A2 and linear FAM114A2 were detected after treated with or without RNase R, and the qRT‐PCR products were performed agarose gel electrophoresis analysis. (D, E) After actinomycin D treatment, relative expression levels of circFAM114A2 and linear FAM114A2 were detected by qRT‐PCR at indicated time point. (F) The cellular distribution of circFAM114A2 was analyzed by nuclear and cytoplasm fractionation assays. β‐Actin and U6 were used as cytoplasmic and nuclear positive controls, respectively. (G) Fluorescence in situ hybridization (FISH) depicting the cytoplasm location of circFAM114A2. Green indicates circFAM114A2. Nuclei were stained with DAPI. Scale bar, 20 μm. ns indicates no significance; **p < 0.01.